Crime rate in Palm Bay, Florida (FL): murders, rapes, robberies, assaults, burglaries, thefts, auto thefts, arson, law enforcement employees, police officers, crime map
Crime rate in Palm Bay, FL
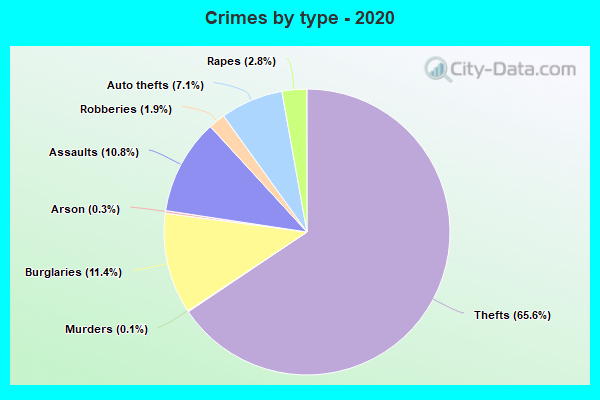
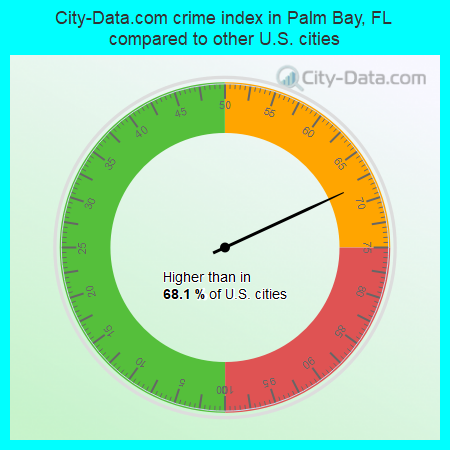
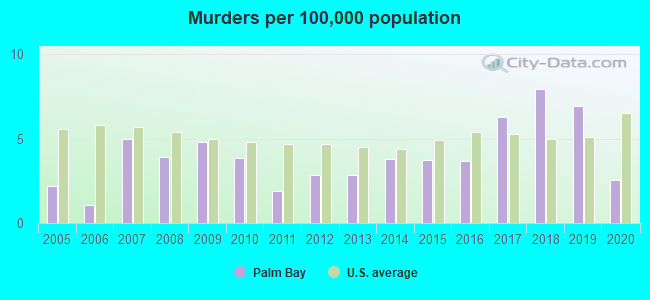
The 2020 crime rate in Palm Bay, FL is 166 (City-Data.com crime index), which is 1.5 times smaller than the U.S. average. It was higher than in 68.1% U.S. cities. The 2020 Palm Bay crime rate fell by 19% compared to 2019. The number of homicides stood at 3 - a decrease of 5 compared to 2019. In the last 5 years Palm Bay has seen decreasing violent crime and decreasing property crime.See how dangerous Palm Bay, FL is compared to the nearest cities:
(Note: Higher means more crime)
(Note: Higher means more crime)
| Palm Bay: | 166.2 |
| West Melbourne: | 120.9 |
| Melbourne Village: | 80.2 |
| Melbourne Beach: | 49.5 |
| Indialantic: | 102.1 |
| Melbourne: | 403.2 |
| Indian Harbour Beach: | 59.3 |
| Satellite Beach: | 89.6 |
| Fellsmere: | 110.5 |
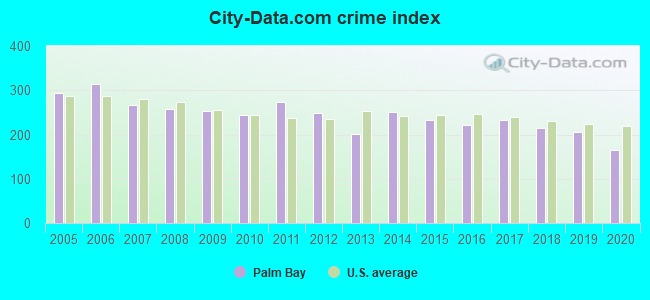
The City-Data.com crime index weighs serious crimes and violent crimes more heavily. Higher means more crime, U.S. average is 246.1. It adjusts for the number of visitors and daily workers commuting into cities.
- means the value is smaller than the state average.- means the value is about the same as the state average.
- means the value is bigger than the state average.
- means the value is much bigger than the state average.
According to our research of Florida and other state lists, there were 223 registered sex offenders living in Palm Bay, Florida as of April 24, 2024.
The ratio of all residents to sex offenders in Palm Bay is 494 to 1.
Violent crime rate in 2020
| Palm Bay: | 169.4 |
| U.S. Average: | 228.2 |
Violent crime rate in 2019
| Palm Bay: | 212.5 |
| U.S. Average: | 219.9 |
Violent crime rate in 2018
| Palm Bay: | 219.2 |
| U.S. Average: | 221.2 |
Violent crime rate in 2017
| Palm Bay: | 279.9 |
| U.S. Average: | 226.2 |
Violent crime rate in 2016
| Palm Bay: | 268.8 |
| U.S. Average: | 227.3 |
Violent crime rate in 2015
| Palm Bay: | 268.2 |
| U.S. Average: | 219.3 |
Violent crime rate in 2014
| Palm Bay: | 308.7 |
| U.S. Average: | 211.1 |
Violent crime rate in 2013
| Palm Bay: | 230.4 |
| U.S. Average: | 214.2 |
Violent crime rate in 2012
| Palm Bay: | 277.6 |
| U.S. Average: | 187.4 |
Violent crime rate in 2011
| Palm Bay: | 300.7 |
| U.S. Average: | 187.1 |
Violent crime rate in 2010
| Palm Bay: | 267.5 |
| U.S. Average: | 195.7 |
Violent crime rate in 2009
| Palm Bay: | 276.9 |
| U.S. Average: | 208.9 |
Violent crime rate in 2008
| Palm Bay: | 282.5 |
| U.S. Average: | 222.5 |
Violent crime rate in 2007
| Palm Bay: | 286.0 |
| U.S. Average: | 229.1 |
Violent crime rate in 2006
| Palm Bay: | 309.6 |
| U.S. Average: | 232.6 |
Violent crime rate in 2005
| Palm Bay: | 254.7 |
| U.S. Average: | 227.0 |
Property crime rate in 2020
| Palm Bay: | 119.4 |
| U.S. Average: | 169.6 |
Property crime rate in 2019
| Palm Bay: | 141.9 |
| U.S. Average: | 179.7 |
Property crime rate in 2018
| Palm Bay: | 157.8 |
| U.S. Average: | 190.2 |
Property crime rate in 2017
| Palm Bay: | 168.8 |
| U.S. Average: | 206.4 |
Property crime rate in 2016
| Palm Bay: | 159.6 |
| U.S. Average: | 216.6 |
Property crime rate in 2015
| Palm Bay: | 171.6 |
| U.S. Average: | 221.5 |
Property crime rate in 2014
| Palm Bay: | 185.9 |
| U.S. Average: | 230.8 |
Property crime rate in 2013
| Palm Bay: | 179.1 |
| U.S. Average: | 250.4 |
Property crime rate in 2012
| Palm Bay: | 233.6 |
| U.S. Average: | 267.3 |
Property crime rate in 2011
| Palm Bay: | 260.7 |
| U.S. Average: | 273.5 |
Property crime rate in 2010
| Palm Bay: | 236.3 |
| U.S. Average: | 276.4 |
Property crime rate in 2009
| Palm Bay: | 228.9 |
| U.S. Average: | 285.6 |
Property crime rate in 2008
| Palm Bay: | 245.6 |
| U.S. Average: | 302.2 |
Property crime rate in 2007
| Palm Bay: | 253.6 |
| U.S. Average: | 309.2 |
Property crime rate in 2006
| Palm Bay: | 324.2 |
| U.S. Average: | 317.3 |
Property crime rate in 2005
| Palm Bay: | 328.8 |
| U.S. Average: | 322.3 |

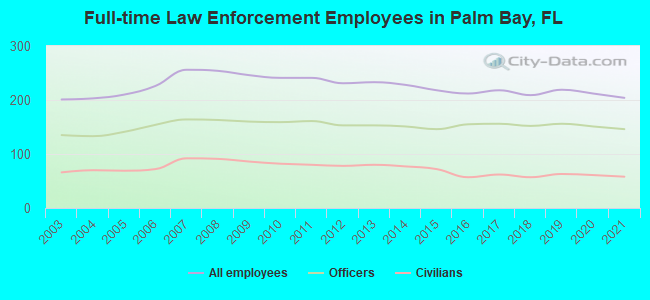
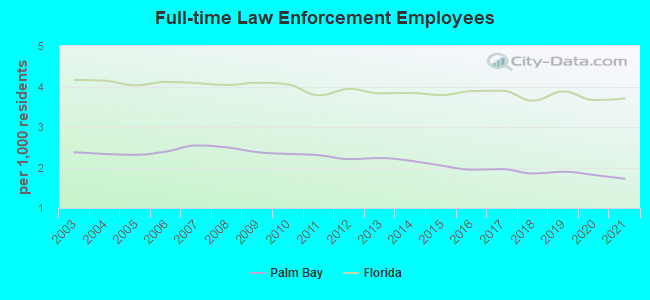
Full-time law enforcement employees in 2021, including police officers: 204 (146 officers - 117 male; 29 female).
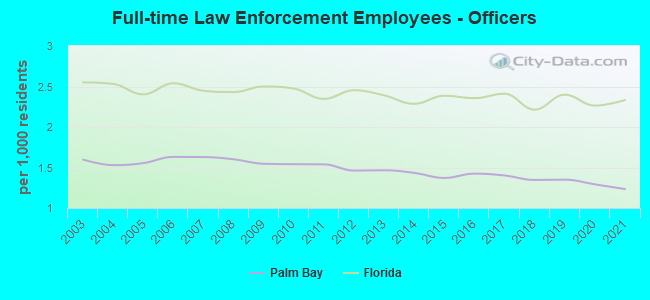
| Officers per 1,000 residents here: | 1.23 |
| Florida average: | 2.33 |
Full-time law enforcement employees in 2020, including police officers: 212 (151 officers - 123 male; 28 female).
| Officers per 1,000 residents here: | 1.29 |
| Florida average: | 2.26 |
Full-time law enforcement employees in 2019, including police officers: 219 (156 officers - 127 male; 29 female).
| Officers per 1,000 residents here: | 1.35 |
| Florida average: | 2.40 |
Full-time law enforcement employees in 2018, including police officers: 209 (152 officers - 129 male; 23 female).
| Officers per 1,000 residents here: | 1.35 |
| Florida average: | 2.21 |
Full-time law enforcement employees in 2017, including police officers: 218 (156 officers - 128 male; 28 female).
| Officers per 1,000 residents here: | 1.40 |
| Florida average: | 2.41 |
Full-time law enforcement employees in 2016, including police officers: 212 (155 officers - 127 male; 28 female).
| Officers per 1,000 residents here: | 1.42 |
| Florida average: | 2.36 |
Full-time law enforcement employees in 2015, including police officers: 218 (146 officers - 118 male; 28 female).
| Officers per 1,000 residents here: | 1.37 |
| Florida average: | 2.39 |
Full-time law enforcement employees in 2014, including police officers: 228 (151 officers - 123 male; 28 female).
| Officers per 1,000 residents here: | 1.43 |
| Florida average: | 2.29 |
Full-time law enforcement employees in 2013, including police officers: 233 (153 officers - 123 male; 30 female).
| Officers per 1,000 residents here: | 1.47 |
| Florida average: | 2.39 |
Full-time law enforcement employees in 2012, including police officers: 231 (153 officers - 124 male; 29 female).
| Officers per 1,000 residents here: | 1.46 |
| Florida average: | 2.45 |
Full-time law enforcement employees in 2011, including police officers: 241 (161 officers - 132 male; 29 female).
| Officers per 1,000 residents here: | 1.54 |
| Florida average: | 2.35 |
Full-time law enforcement employees in 2010, including police officers: 241 (159 officers - 128 male; 31 female).
| Officers per 1,000 residents here: | 1.54 |
| Florida average: | 2.47 |
Full-time law enforcement employees in 2009, including police officers: 246 (160 officers - 132 male; 28 female).
| Officers per 1,000 residents here: | 1.55 |
| Florida average: | 2.50 |
Full-time law enforcement employees in 2008, including police officers: 254 (163 officers - 134 male; 29 female).
| Officers per 1,000 residents here: | 1.60 |
| Florida average: | 2.43 |
Full-time law enforcement employees in 2007, including police officers: 256 (164 officers - 139 male; 25 female).
| Officers per 1,000 residents here: | 1.63 |
| Florida average: | 2.45 |
Full-time law enforcement employees in 2006, including police officers: 226 (154 officers - 129 male; 25 female).
| Officers per 1,000 residents here: | 1.63 |
| Florida average: | 2.54 |
Full-time law enforcement employees in 2005, including police officers: 210 (141 officers - 122 male; 19 female).
| Officers per 1,000 residents here: | 1.55 |
| Florida average: | 2.40 |
Full-time law enforcement employees in 2004, including police officers: 203 (133 officers - 114 male; 19 female).
| Officers per 1,000 residents here: | 1.53 |
| Florida average: | 2.53 |
Full-time law enforcement employees in 2003, including police officers: 201 (135 officers - 115 male; 20 female).
| Officers per 1,000 residents here: | 1.60 |
| Florida average: | 2.55 |