Crime rate in Pembroke Pines, Florida (FL): murders, rapes, robberies, assaults, burglaries, thefts, auto thefts, arson, law enforcement employees, police officers, crime map
Crime rate in Pembroke Pines, FL
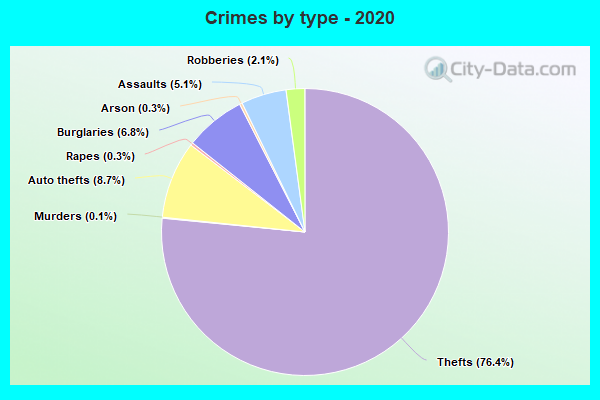
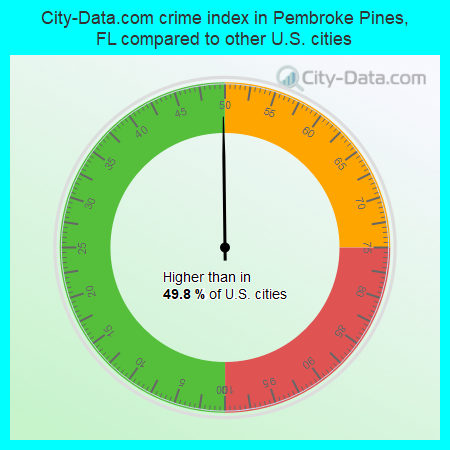
The 2020 crime rate in Pembroke Pines, FL is 100 (City-Data.com crime index), which is 2.5 times smaller than the U.S. average. It was higher than in 49.8% U.S. cities. The 2020 Pembroke Pines crime rate fell by 34% compared to 2019. The number of homicides stood at 4 - a decrease of 3 compared to 2019. In the last 5 years Pembroke Pines has seen decreasing violent crime and decline of property crime.See how dangerous Pembroke Pines, FL is compared to the nearest cities:
(Note: Higher means more crime)
(Note: Higher means more crime)
| Pembroke Pines: | 99.5 |
| Cooper City: | 75.8 |
| Miramar: | 127.9 |
| Southwest Ranches: | 163.1 |
| Davie: | 91.6 |
| Miami Lakes: | 110.2 |
| West Park: | 297.5 |
| Weston: | 42.8 |
| Hollywood: | 224.1 |
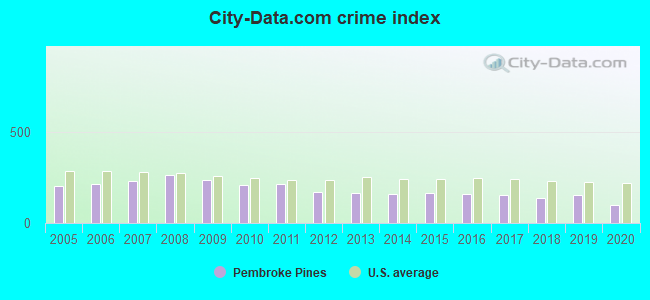
The City-Data.com crime index weighs serious crimes and violent crimes more heavily. Higher means more crime, U.S. average is 246.1. It adjusts for the number of visitors and daily workers commuting into cities.
- means the value is smaller than the state average.- means the value is about the same as the state average.
- means the value is bigger than the state average.
According to our research of Florida and other state lists, there were 28 registered sex offenders living in Pembroke Pines, Florida as of April 25, 2024.
The ratio of all residents to sex offenders in Pembroke Pines is 6,021 to 1.
The ratio of registered sex offenders to all residents in this city is much lower than the state average.
Violent crime rate in 2020
| Pembroke Pines: | 65.4 |
| U.S. Average: | 228.2 |
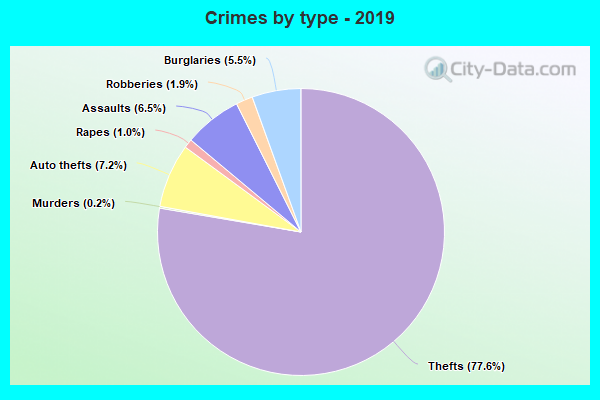
Violent crime rate in 2019
| Pembroke Pines: | 118.0 |
| U.S. Average: | 219.9 |
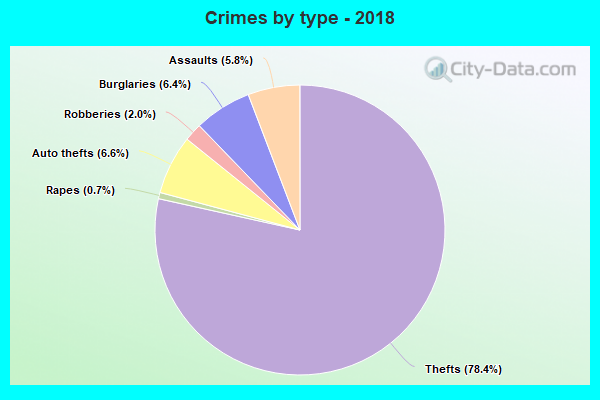
Violent crime rate in 2018
| Pembroke Pines: | 99.1 |
| U.S. Average: | 221.2 |
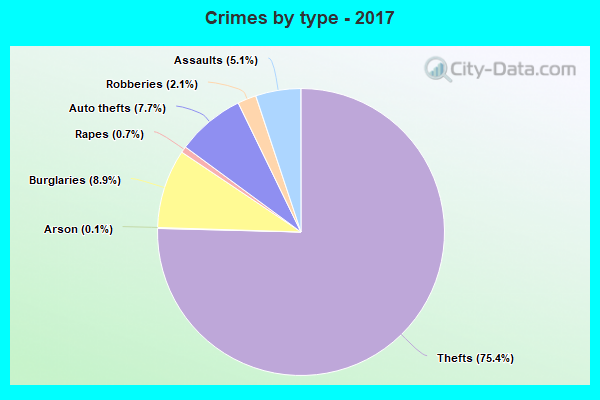
Violent crime rate in 2017
| Pembroke Pines: | 102.7 |
| U.S. Average: | 226.2 |
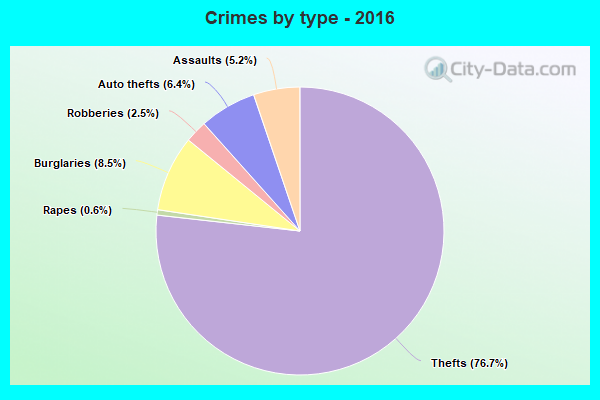
Violent crime rate in 2016
| Pembroke Pines: | 109.7 |
| U.S. Average: | 227.3 |
Violent crime rate in 2015
| Pembroke Pines: | 121.1 |
| U.S. Average: | 219.3 |
Violent crime rate in 2014
| Pembroke Pines: | 95.2 |
| U.S. Average: | 211.1 |
Violent crime rate in 2013
| Pembroke Pines: | 88.2 |
| U.S. Average: | 214.2 |
Violent crime rate in 2012
| Pembroke Pines: | 80.8 |
| U.S. Average: | 187.4 |
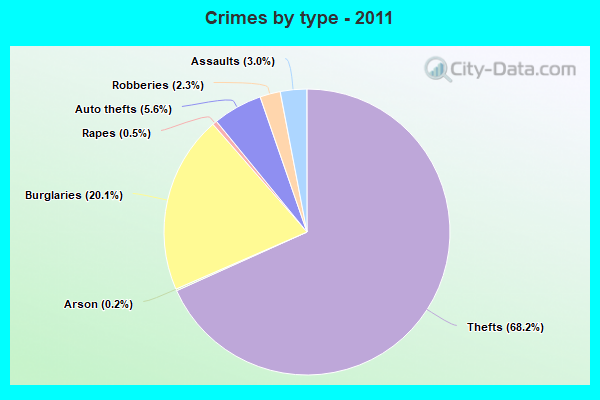
Violent crime rate in 2011
| Pembroke Pines: | 111.6 |
| U.S. Average: | 187.1 |
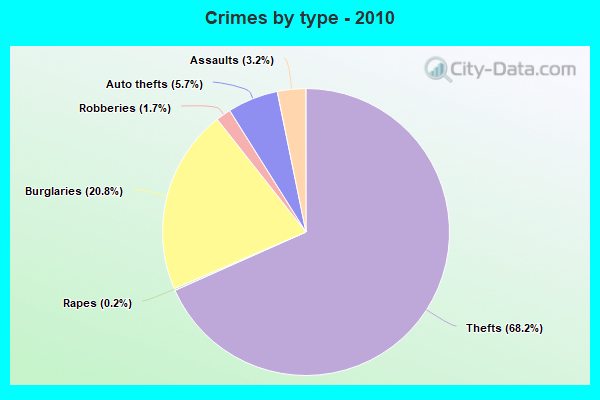
Violent crime rate in 2010
| Pembroke Pines: | 96.9 |
| U.S. Average: | 195.7 |
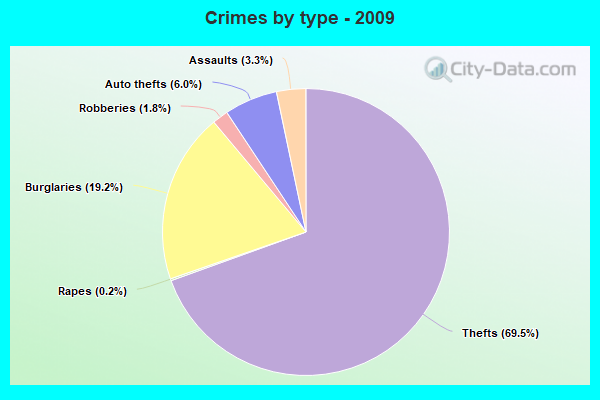
Violent crime rate in 2009
| Pembroke Pines: | 110.6 |
| U.S. Average: | 208.9 |
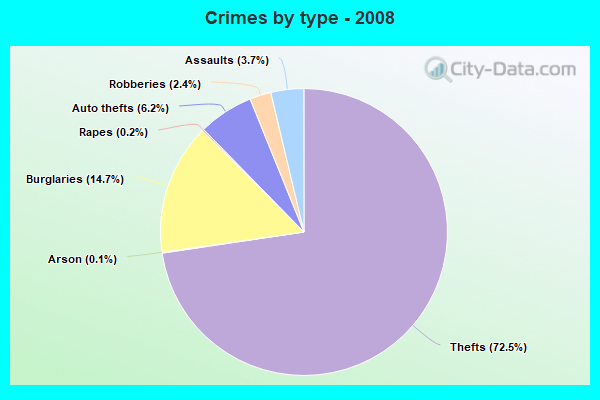
Violent crime rate in 2008
| Pembroke Pines: | 145.1 |
| U.S. Average: | 222.5 |
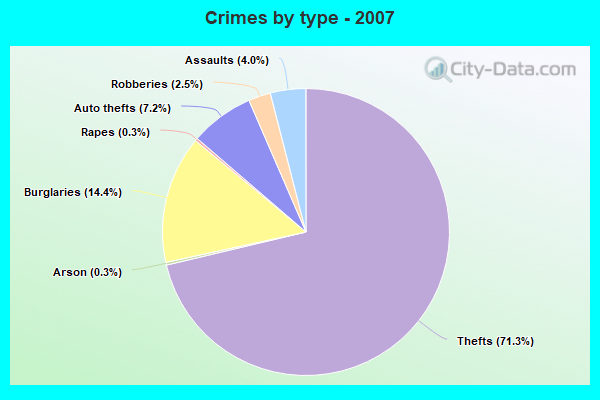
Violent crime rate in 2007
| Pembroke Pines: | 129.5 |
| U.S. Average: | 229.1 |
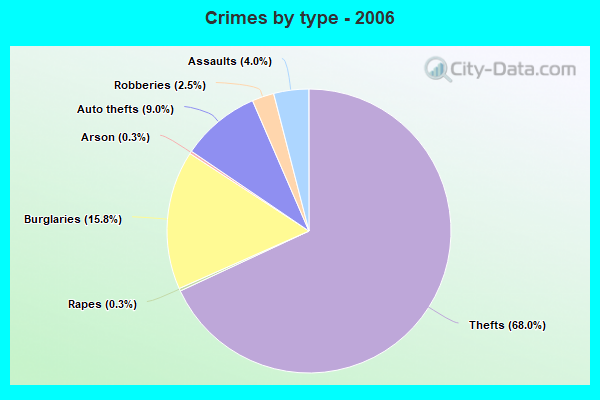
Violent crime rate in 2006
| Pembroke Pines: | 120.7 |
| U.S. Average: | 232.6 |
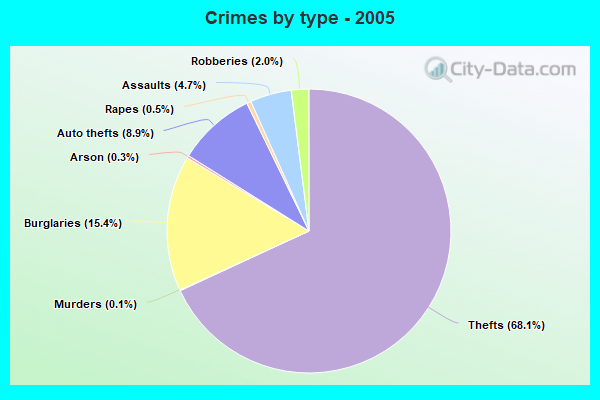
Violent crime rate in 2005
| Pembroke Pines: | 125.0 |
| U.S. Average: | 227.0 |
Property crime rate in 2020
| Pembroke Pines: | 100.2 |
| U.S. Average: | 169.6 |
Property crime rate in 2019
| Pembroke Pines: | 128.6 |
| U.S. Average: | 179.7 |
Property crime rate in 2018
| Pembroke Pines: | 130.3 |
| U.S. Average: | 190.2 |
Property crime rate in 2017
| Pembroke Pines: | 158.8 |
| U.S. Average: | 206.4 |
Property crime rate in 2016
| Pembroke Pines: | 157.1 |
| U.S. Average: | 216.6 |
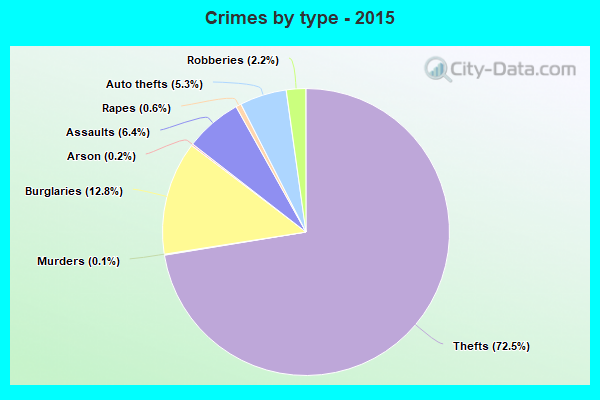
Property crime rate in 2015
| Pembroke Pines: | 166.6 |
| U.S. Average: | 221.5 |
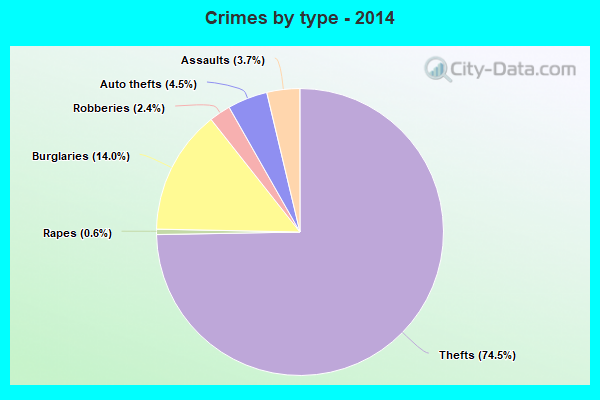
Property crime rate in 2014
| Pembroke Pines: | 177.9 |
| U.S. Average: | 230.8 |
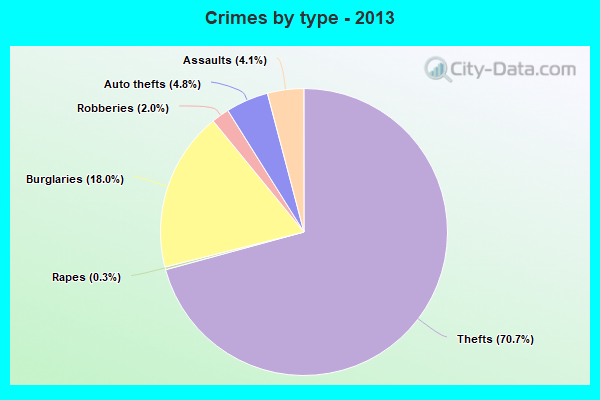
Property crime rate in 2013
| Pembroke Pines: | 208.6 |
| U.S. Average: | 250.4 |
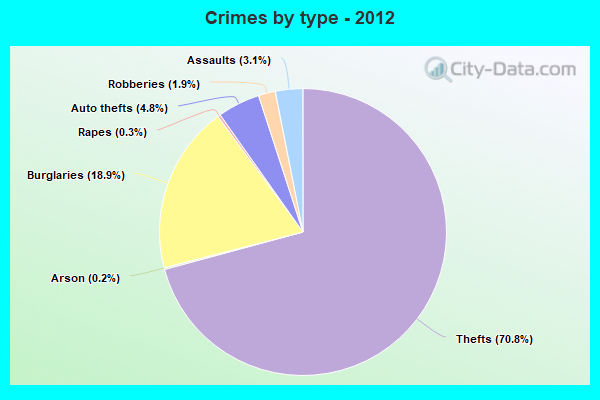
Property crime rate in 2012
| Pembroke Pines: | 225.7 |
| U.S. Average: | 267.3 |
Property crime rate in 2011
| Pembroke Pines: | 277.6 |
| U.S. Average: | 273.5 |
Property crime rate in 2010
| Pembroke Pines: | 288.9 |
| U.S. Average: | 276.4 |
Property crime rate in 2009
| Pembroke Pines: | 321.0 |
| U.S. Average: | 285.6 |
Property crime rate in 2008
| Pembroke Pines: | 319.8 |
| U.S. Average: | 302.2 |
Property crime rate in 2007
| Pembroke Pines: | 276.1 |
| U.S. Average: | 309.2 |
Property crime rate in 2006
| Pembroke Pines: | 263.7 |
| U.S. Average: | 317.3 |
Property crime rate in 2005
| Pembroke Pines: | 238.7 |
| U.S. Average: | 322.3 |
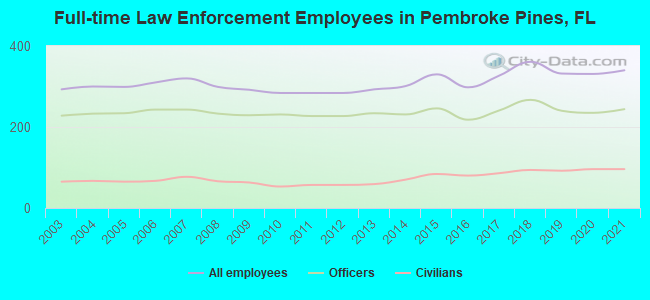
Full-time law enforcement employees in 2021, including police officers: 340 (244 officers - 209 male; 35 female).
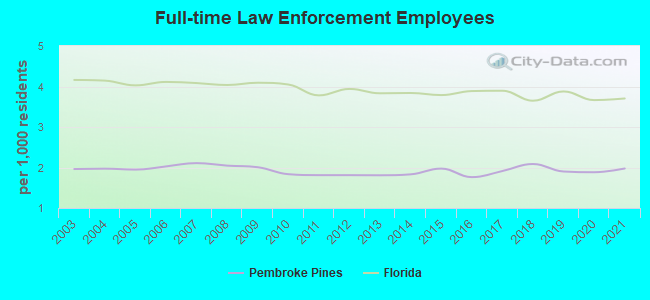
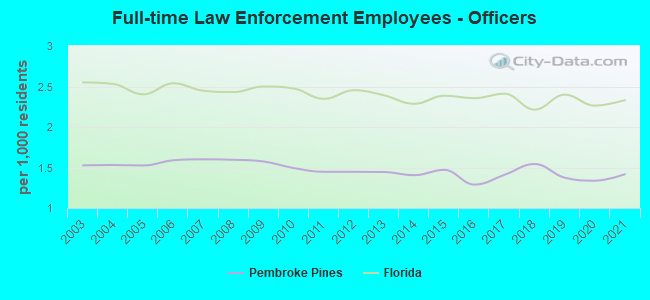
| Officers per 1,000 residents here: | 1.42 |
| Florida average: | 2.33 |
Full-time law enforcement employees in 2020, including police officers: 331 (235 officers - 200 male; 35 female).
| Officers per 1,000 residents here: | 1.34 |
| Florida average: | 2.26 |
Full-time law enforcement employees in 2019, including police officers: 332 (240 officers - 203 male; 37 female).
| Officers per 1,000 residents here: | 1.37 |
| Florida average: | 2.40 |
Full-time law enforcement employees in 2018, including police officers: 361 (267 officers - 233 male; 34 female).
| Officers per 1,000 residents here: | 1.54 |
| Florida average: | 2.21 |
Full-time law enforcement employees in 2017, including police officers: 327 (241 officers - 208 male; 33 female).
| Officers per 1,000 residents here: | 1.41 |
| Florida average: | 2.41 |
Full-time law enforcement employees in 2016, including police officers: 298 (218 officers - 185 male; 33 female).
| Officers per 1,000 residents here: | 1.29 |
| Florida average: | 2.36 |
Full-time law enforcement employees in 2015, including police officers: 330 (246 officers - 211 male; 35 female).
| Officers per 1,000 residents here: | 1.47 |
| Florida average: | 2.39 |
Full-time law enforcement employees in 2014, including police officers: 301 (231 officers - 198 male; 33 female).
| Officers per 1,000 residents here: | 1.41 |
| Florida average: | 2.29 |
Full-time law enforcement employees in 2013, including police officers: 293 (234 officers - 200 male; 34 female).
| Officers per 1,000 residents here: | 1.44 |
| Florida average: | 2.39 |
Full-time law enforcement employees in 2011, including police officers: 284 (227 officers - 193 male; 34 female).
| Officers per 1,000 residents here: | 1.45 |
| Florida average: | 2.35 |
Full-time law enforcement employees in 2010, including police officers: 284 (231 officers - 196 male; 35 female).
| Officers per 1,000 residents here: | 1.49 |
| Florida average: | 2.47 |
Full-time law enforcement employees in 2009, including police officers: 292 (229 officers - 193 male; 36 female).
| Officers per 1,000 residents here: | 1.57 |
| Florida average: | 2.50 |
Full-time law enforcement employees in 2008, including police officers: 299 (233 officers - 200 male; 33 female).
| Officers per 1,000 residents here: | 1.59 |
| Florida average: | 2.43 |
Full-time law enforcement employees in 2007, including police officers: 320 (243 officers - 209 male; 34 female).
| Officers per 1,000 residents here: | 1.60 |
| Florida average: | 2.45 |
Full-time law enforcement employees in 2006, including police officers: 310 (243 officers - 211 male; 32 female).
| Officers per 1,000 residents here: | 1.59 |
| Florida average: | 2.54 |
Full-time law enforcement employees in 2005, including police officers: 299 (234 officers - 199 male; 35 female).
| Officers per 1,000 residents here: | 1.52 |
| Florida average: | 2.40 |
Full-time law enforcement employees in 2004, including police officers: 300 (233 officers - 204 male; 29 female).
| Officers per 1,000 residents here: | 1.53 |
| Florida average: | 2.53 |
Full-time law enforcement employees in 2003, including police officers: 293 (228 officers - 202 male; 26 female).
| Officers per 1,000 residents here: | 1.53 |
| Florida average: | 2.55 |