Crime rate in Plano, Texas (TX): murders, rapes, robberies, assaults, burglaries, thefts, auto thefts, arson, law enforcement employees, police officers, crime map
Crime rate in Plano, TX
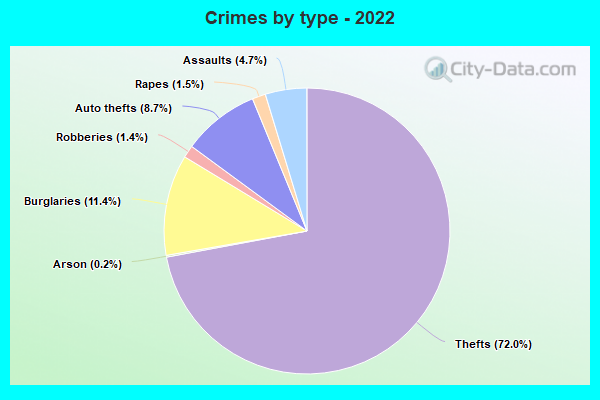
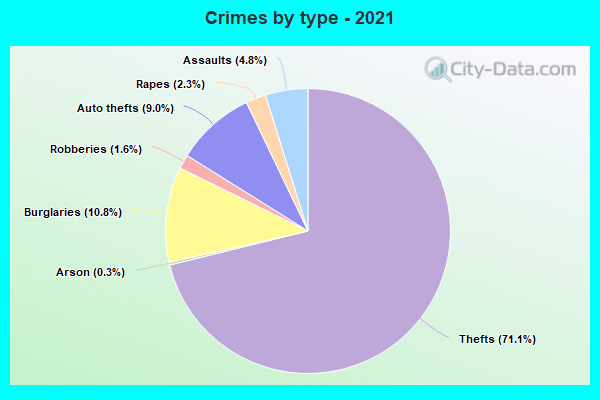
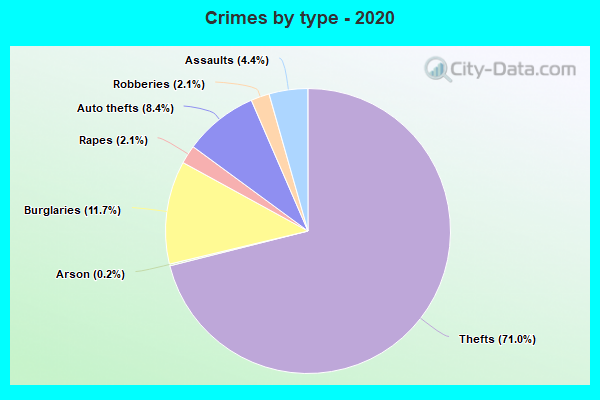
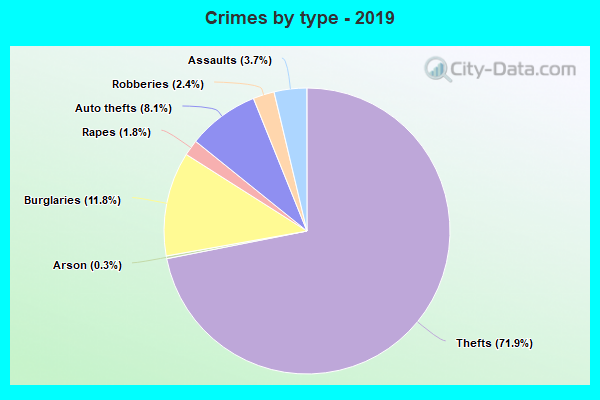
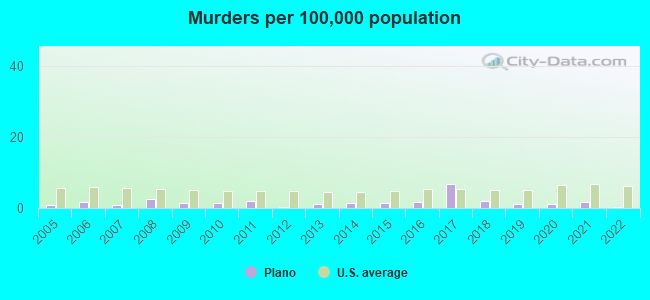
The 2022 crime rate in Plano, TX is 144 (City-Data.com crime index), which is 1.7 times lower than the U.S. average. It was higher than in 63.0% U.S. cities. The 2022 Plano crime rate rose by 2% compared to 2021. The number of homicides stood at 1 - a decrease of 4 compared to 2021. In the last 5 years Plano has seen increasing violent crime and increasing property crime.See how dangerous Plano, TX is compared to the nearest cities:
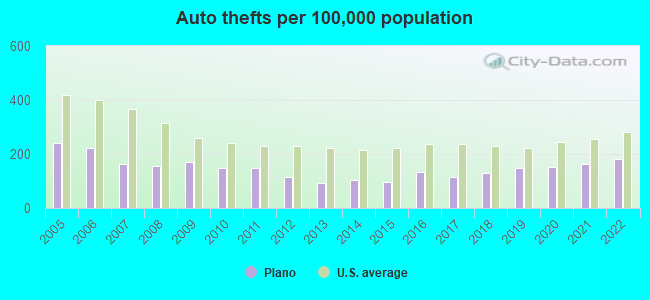
(Note: Higher means more crime)
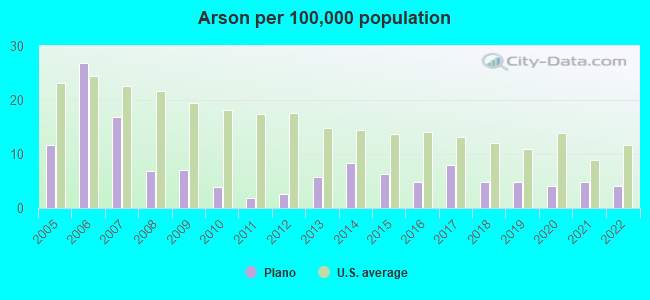
(Note: Higher means more crime)
| Plano: | 144.1 |
| Allen: | 76.6 |
| Richardson: | 166.0 |
| Parker: | 32.7 |
| Frisco: | 92.1 |
| Addison: | 561.3 |
| The Colony: | 230.7 |
| Murphy: | 38.7 |
| Carrollton: | 147.7 |
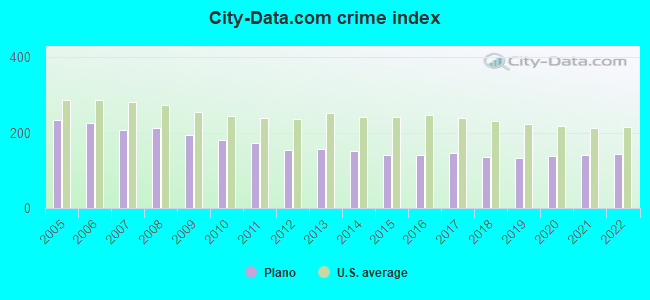
The City-Data.com crime index weighs serious crimes and violent crimes more heavily. Higher means more crime, U.S. average is 246.1. It adjusts for the number of visitors and daily workers commuting into cities.
- means the value is smaller than the state average.- means the value is about the same as the state average.
- means the value is bigger than the state average.
According to our research of Texas and other state lists, there were 136 registered sex offenders living in Plano, Texas as of April 23, 2024.
The ratio of all residents to sex offenders in Plano is 2,103 to 1.
The ratio of registered sex offenders to all residents in this city is much lower than the state average.
Violent crime rate in 2022
| Plano: | 95.2 |
| U.S. Average: | 219.8 |
Violent crime rate in 2021
| Plano: | 103.2 |
| U.S. Average: | 224.8 |
Violent crime rate in 2020
| Plano: | 98.0 |
| U.S. Average: | 228.2 |
Violent crime rate in 2019
| Plano: | 89.7 |
| U.S. Average: | 219.9 |
Violent crime rate in 2018
| Plano: | 90.0 |
| U.S. Average: | 221.2 |
Violent crime rate in 2017
| Plano: | 101.2 |
| U.S. Average: | 226.2 |
Violent crime rate in 2016
| Plano: | 85.7 |
| U.S. Average: | 227.3 |
Violent crime rate in 2015
| Plano: | 95.4 |
| U.S. Average: | 219.3 |
Violent crime rate in 2014
| Plano: | 99.2 |
| U.S. Average: | 211.1 |
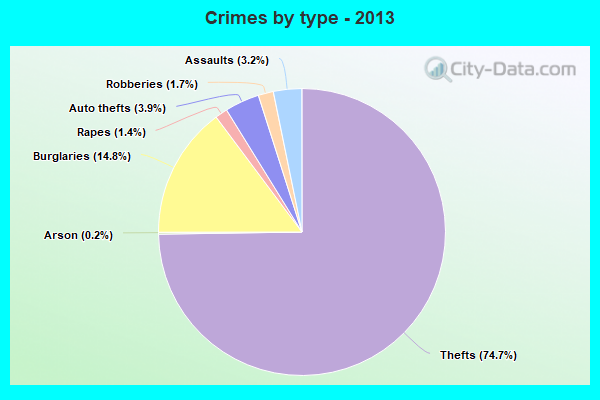
Violent crime rate in 2013
| Plano: | 92.1 |
| U.S. Average: | 214.2 |
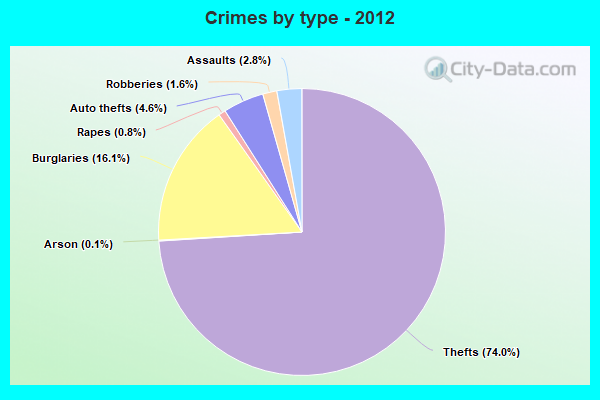
Violent crime rate in 2012
| Plano: | 76.0 |
| U.S. Average: | 187.4 |
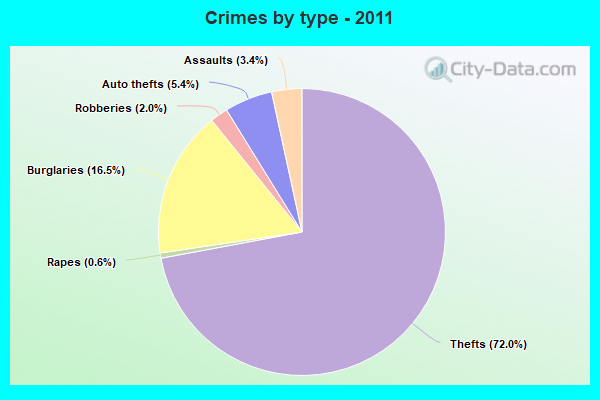
Violent crime rate in 2011
| Plano: | 93.3 |
| U.S. Average: | 187.1 |
Violent crime rate in 2010
| Plano: | 105.4 |
| U.S. Average: | 195.7 |
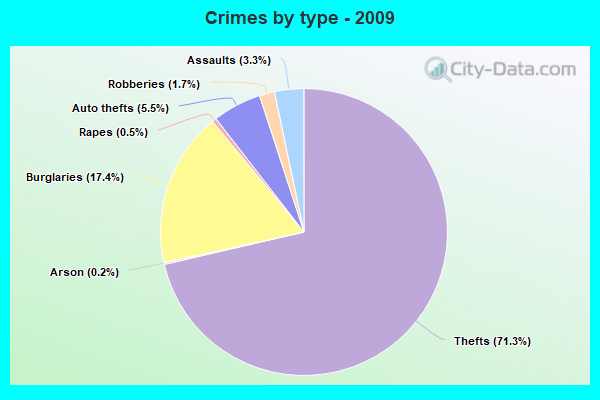
Violent crime rate in 2009
| Plano: | 97.0 |
| U.S. Average: | 208.9 |
Violent crime rate in 2008
| Plano: | 126.8 |
| U.S. Average: | 222.5 |
Violent crime rate in 2007
| Plano: | 134.1 |
| U.S. Average: | 229.1 |
Violent crime rate in 2006
| Plano: | 147.4 |
| U.S. Average: | 232.6 |
Violent crime rate in 2005
| Plano: | 152.0 |
| U.S. Average: | 227.0 |
Property crime rate in 2022
| Plano: | 148.1 |
| U.S. Average: | 166.5 |
Property crime rate in 2021
| Plano: | 127.0 |
| U.S. Average: | 157.8 |
Property crime rate in 2020
| Plano: | 129.4 |
| U.S. Average: | 169.6 |
Property crime rate in 2019
| Plano: | 130.4 |
| U.S. Average: | 179.7 |
Property crime rate in 2018
| Plano: | 136.0 |
| U.S. Average: | 190.2 |
Property crime rate in 2017
| Plano: | 135.8 |
| U.S. Average: | 206.4 |
Property crime rate in 2016
| Plano: | 155.6 |
| U.S. Average: | 216.6 |
Property crime rate in 2015
| Plano: | 138.6 |
| U.S. Average: | 221.5 |
Property crime rate in 2014
| Plano: | 154.2 |
| U.S. Average: | 230.8 |
Property crime rate in 2013
| Plano: | 169.3 |
| U.S. Average: | 250.4 |
Property crime rate in 2012
| Plano: | 189.3 |
| U.S. Average: | 267.3 |
Property crime rate in 2011
| Plano: | 210.0 |
| U.S. Average: | 273.5 |
Property crime rate in 2010
| Plano: | 215.9 |
| U.S. Average: | 276.4 |
Property crime rate in 2009
| Plano: | 245.7 |
| U.S. Average: | 285.6 |
Property crime rate in 2008
| Plano: | 254.5 |
| U.S. Average: | 302.2 |
Property crime rate in 2007
| Plano: | 238.8 |
| U.S. Average: | 309.2 |
Property crime rate in 2006
| Plano: | 258.9 |
| U.S. Average: | 317.3 |
Property crime rate in 2005
| Plano: | 268.7 |
| U.S. Average: | 322.3 |
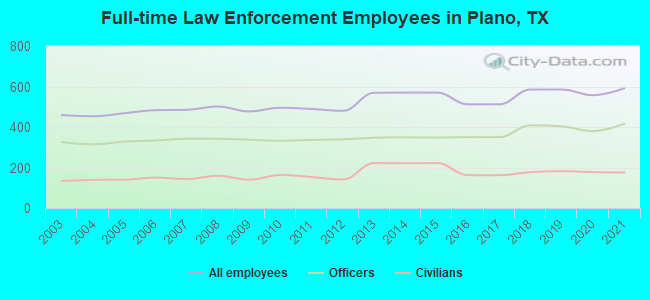
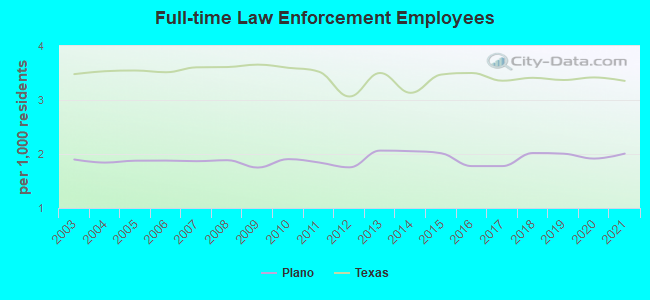
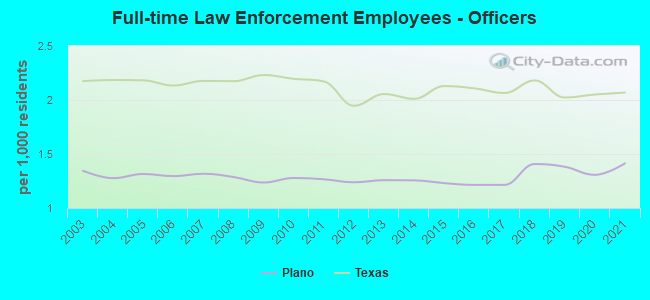
Full-time law enforcement employees in 2021, including police officers: 591 (416 officers - 348 male; 68 female).
| Officers per 1,000 residents here: | 1.41 |
| Texas average: | 2.07 |
Full-time law enforcement employees in 2020, including police officers: 557 (380 officers - 325 male; 55 female).
| Officers per 1,000 residents here: | 1.31 |
| Texas average: | 2.05 |
Full-time law enforcement employees in 2019, including police officers: 585 (403 officers - 344 male; 59 female).
| Officers per 1,000 residents here: | 1.38 |
| Texas average: | 2.02 |
Full-time law enforcement employees in 2018, including police officers: 585 (408 officers - 353 male; 55 female).
| Officers per 1,000 residents here: | 1.41 |
| Texas average: | 2.18 |
Full-time law enforcement employees in 2016, including police officers: 512 (350 officers - 312 male; 38 female).
| Officers per 1,000 residents here: | 1.21 |
| Texas average: | 2.11 |
Full-time law enforcement employees in 2015, including police officers: 570 (348 officers - 310 male; 38 female).
| Officers per 1,000 residents here: | 1.23 |
| Texas average: | 2.13 |
Full-time law enforcement employees in 2014, including police officers: 570 (349 officers - 307 male; 42 female).
| Officers per 1,000 residents here: | 1.26 |
| Texas average: | 2.01 |
Full-time law enforcement employees in 2013, including police officers: 569 (347 officers - 307 male; 40 female).
| Officers per 1,000 residents here: | 1.26 |
| Texas average: | 2.05 |
Full-time law enforcement employees in 2012, including police officers: 480 (339 officers - 301 male; 38 female).
| Officers per 1,000 residents here: | 1.24 |
| Texas average: | 1.95 |
Full-time law enforcement employees in 2011, including police officers: 489 (336 officers - 297 male; 39 female).
| Officers per 1,000 residents here: | 1.27 |
| Texas average: | 2.17 |
Full-time law enforcement employees in 2010, including police officers: 495 (332 officers - 294 male; 38 female).
| Officers per 1,000 residents here: | 1.28 |
| Texas average: | 2.20 |
Full-time law enforcement employees in 2009, including police officers: 477 (337 officers - 297 male; 40 female).
| Officers per 1,000 residents here: | 1.24 |
| Texas average: | 2.23 |
Full-time law enforcement employees in 2008, including police officers: 501 (342 officers - 302 male; 40 female).
| Officers per 1,000 residents here: | 1.29 |
| Texas average: | 2.17 |
Full-time law enforcement employees in 2007, including police officers: 485 (342 officers - 305 male; 37 female).
| Officers per 1,000 residents here: | 1.32 |
| Texas average: | 2.18 |
Full-time law enforcement employees in 2006, including police officers: 483 (333 officers - 292 male; 41 female).
| Officers per 1,000 residents here: | 1.29 |
| Texas average: | 2.13 |
Full-time law enforcement employees in 2005, including police officers: 468 (328 officers - 289 male; 39 female).
| Officers per 1,000 residents here: | 1.31 |
| Texas average: | 2.18 |
Full-time law enforcement employees in 2004, including police officers: 453 (314 officers - 279 male; 35 female).
| Officers per 1,000 residents here: | 1.28 |
| Texas average: | 2.19 |
Full-time law enforcement employees in 2003, including police officers: 459 (325 officers - 289 male; 36 female).
| Officers per 1,000 residents here: | 1.34 |
| Texas average: | 2.17 |