Crime rate in Port St. Lucie, Florida (FL): murders, rapes, robberies, assaults, burglaries, thefts, auto thefts, arson, law enforcement employees, police officers, crime map
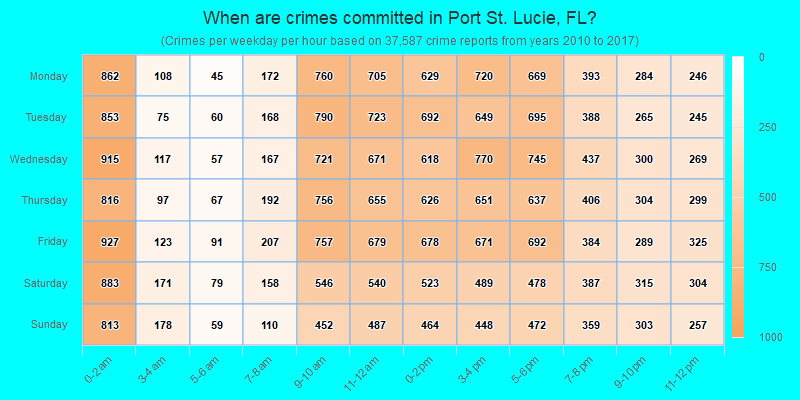
Crime rate in Port St. Lucie, FL
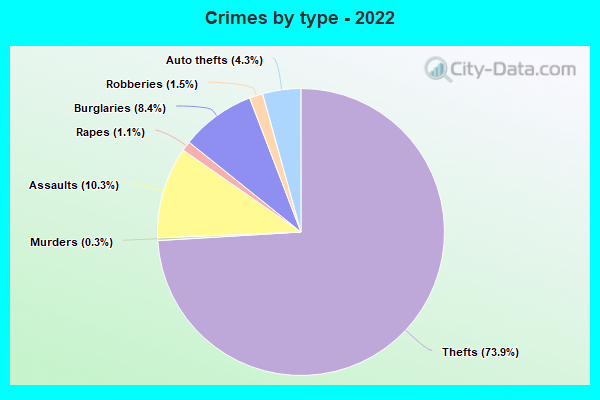
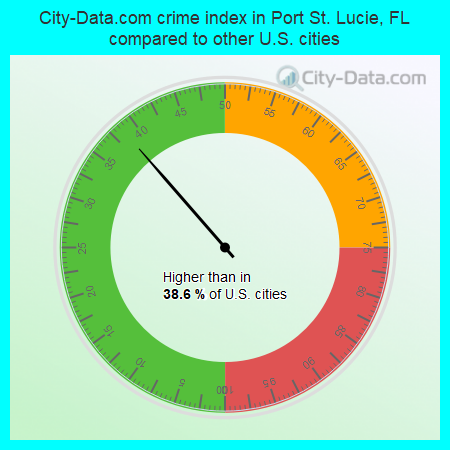
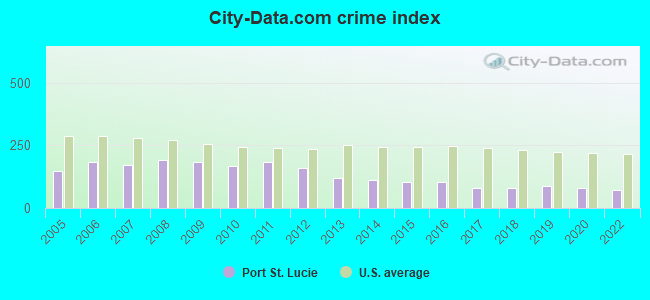
The 2022 crime rate in Port St. Lucie, FL is 70 (City-Data.com crime index), which is 3.5 times smaller than the U.S. average. It was higher than in 38.6% U.S. cities. The 2022 Port St. Lucie crime rate fell by 12% compared to 2020. The number of homicides stood at 6 - an increase of 1 compared to 2020. In the last 5 years Port St. Lucie has seen increasing violent crime and decline of property crime.See how dangerous Port St. Lucie, FL is compared to the nearest cities:
(Note: Higher means more crime)
(Note: Higher means more crime)
| Port St. Lucie: | 69.6 |
| Stuart: | 181.2 |
| Sewall's Point: | 28.9 |
| Fort Pierce: | 258.6 |
| Jupiter Island: | 17.8 |
| Tequesta: | 18.9 |
| Jupiter Inlet Colony: | 43.6 |
| Jupiter: | 87.6 |
| Okeechobee: | 201.1 |
The City-Data.com crime index weighs serious crimes and violent crimes more heavily. Higher means more crime, U.S. average is 246.1. It adjusts for the number of visitors and daily workers commuting into cities.
- means the value is smaller than the state average.- means the value is about the same as the state average.
According to our research of Florida and other state lists, there were 172 registered sex offenders living in Port St. Lucie, Florida as of April 17, 2024.
The ratio of all residents to sex offenders in Port St. Lucie is 1,068 to 1.
The ratio of registered sex offenders to all residents in this city is lower than the state average.
Violent crime rate in 2022
| Port St. Lucie: | 67.3 |
| U.S. Average: | 219.8 |
Violent crime rate in 2020
| Port St. Lucie: | 76.0 |
| U.S. Average: | 228.2 |
Violent crime rate in 2019
| Port St. Lucie: | 89.5 |
| U.S. Average: | 219.9 |
Violent crime rate in 2018
| Port St. Lucie: | 64.7 |
| U.S. Average: | 221.2 |
Violent crime rate in 2017
| Port St. Lucie: | 54.3 |
| U.S. Average: | 226.2 |
Violent crime rate in 2016
| Port St. Lucie: | 82.5 |
| U.S. Average: | 227.3 |
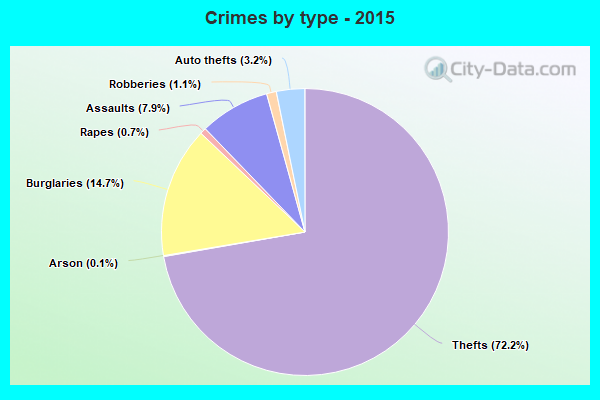
Violent crime rate in 2015
| Port St. Lucie: | 80.5 |
| U.S. Average: | 219.3 |
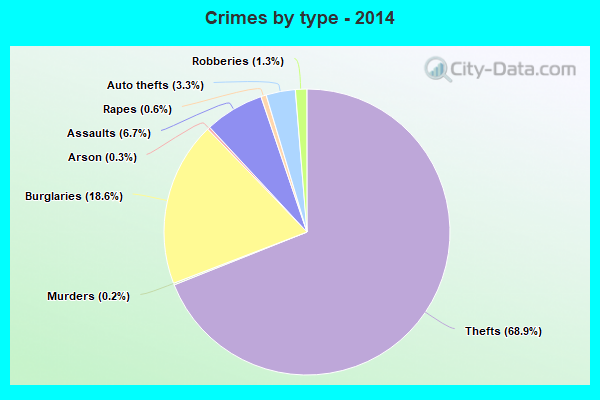
Violent crime rate in 2014
| Port St. Lucie: | 80.3 |
| U.S. Average: | 211.1 |
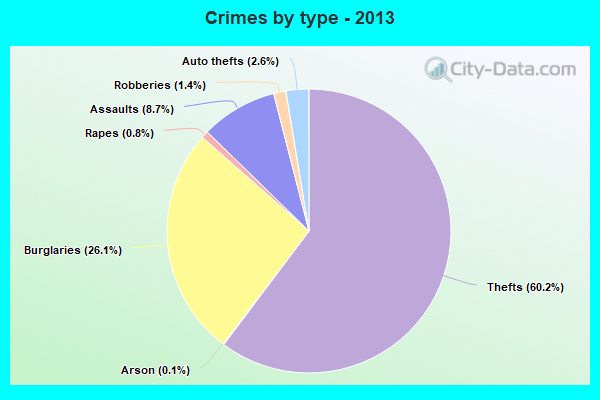
Violent crime rate in 2013
| Port St. Lucie: | 96.2 |
| U.S. Average: | 214.2 |
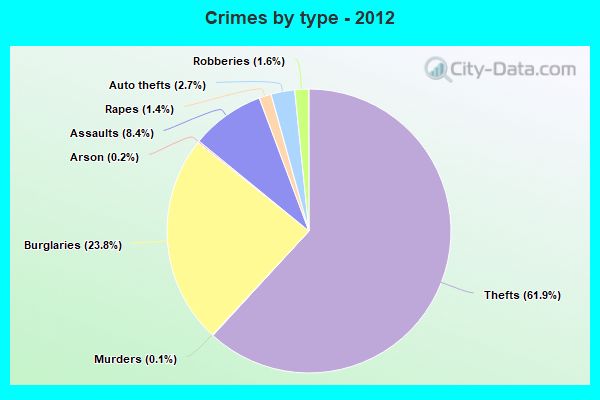
Violent crime rate in 2012
| Port St. Lucie: | 134.8 |
| U.S. Average: | 187.4 |
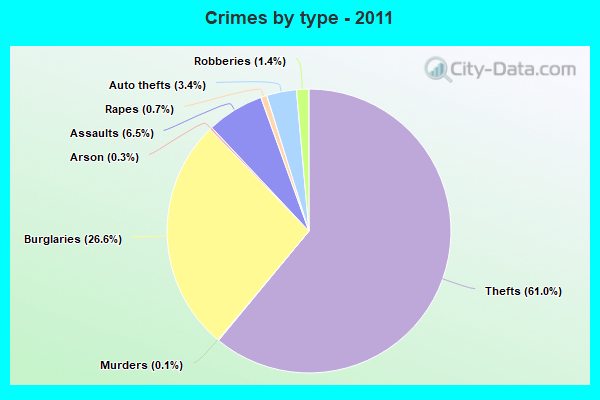
Violent crime rate in 2011
| Port St. Lucie: | 125.6 |
| U.S. Average: | 187.1 |
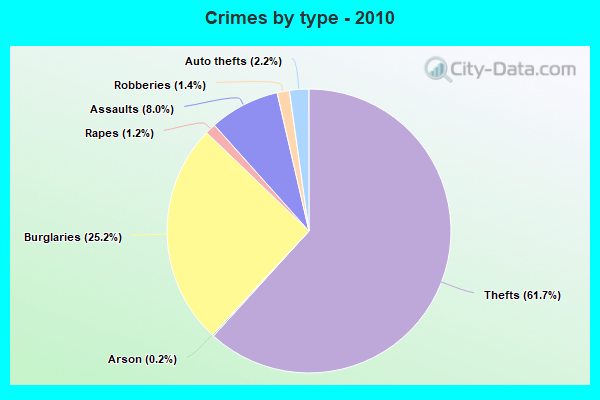
Violent crime rate in 2010
| Port St. Lucie: | 133.7 |
| U.S. Average: | 195.7 |
Violent crime rate in 2009
| Port St. Lucie: | 144.8 |
| U.S. Average: | 208.9 |
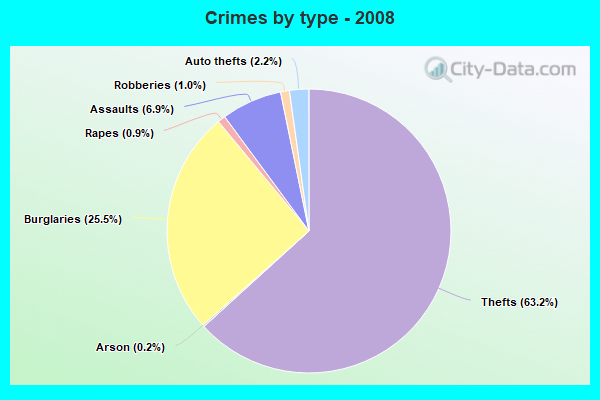
Violent crime rate in 2008
| Port St. Lucie: | 135.9 |
| U.S. Average: | 222.5 |
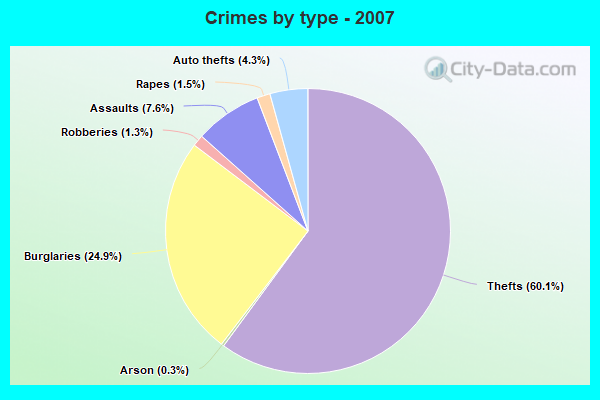
Violent crime rate in 2007
| Port St. Lucie: | 135.5 |
| U.S. Average: | 229.1 |
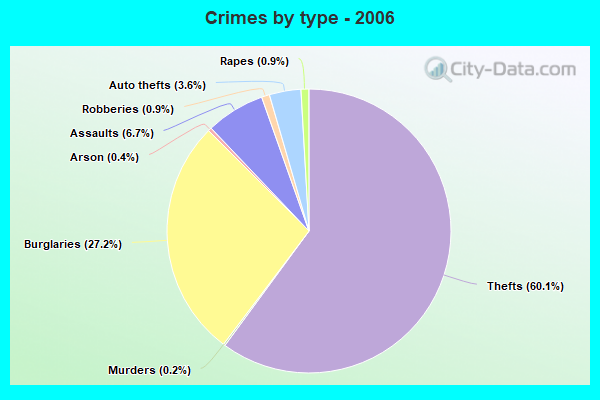
Violent crime rate in 2006
| Port St. Lucie: | 127.1 |
| U.S. Average: | 232.6 |
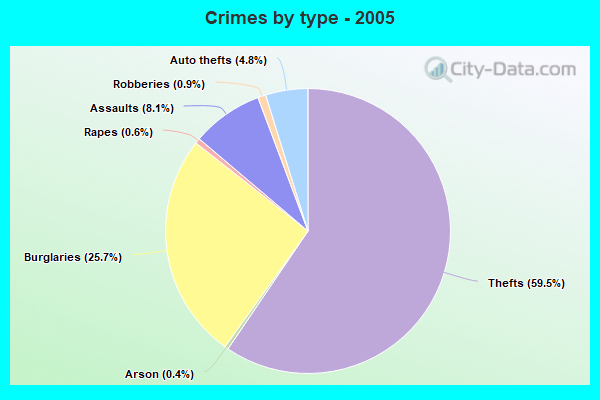
Violent crime rate in 2005
| Port St. Lucie: | 108.7 |
| U.S. Average: | 227.0 |
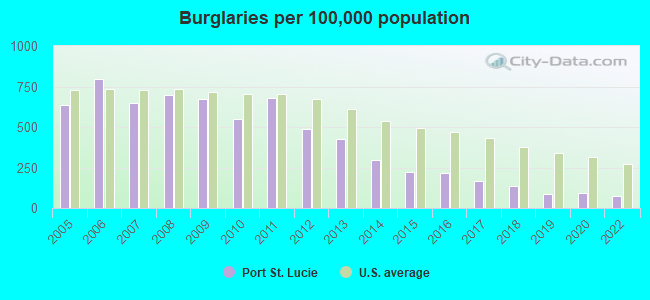
Property crime rate in 2022
| Port St. Lucie: | 53.0 |
| U.S. Average: | 166.5 |
Property crime rate in 2020
| Port St. Lucie: | 58.7 |
| U.S. Average: | 169.6 |
Property crime rate in 2019
| Port St. Lucie: | 59.9 |
| U.S. Average: | 179.7 |
Property crime rate in 2018
| Port St. Lucie: | 71.5 |
| U.S. Average: | 190.2 |
Property crime rate in 2017
| Port St. Lucie: | 85.5 |
| U.S. Average: | 206.4 |
Property crime rate in 2016
| Port St. Lucie: | 103.9 |
| U.S. Average: | 216.6 |
Property crime rate in 2015
| Port St. Lucie: | 106.4 |
| U.S. Average: | 221.5 |
Property crime rate in 2014
| Port St. Lucie: | 122.1 |
| U.S. Average: | 230.8 |
Property crime rate in 2013
| Port St. Lucie: | 140.5 |
| U.S. Average: | 250.4 |
Property crime rate in 2012
| Port St. Lucie: | 168.1 |
| U.S. Average: | 267.3 |
Property crime rate in 2011
| Port St. Lucie: | 225.7 |
| U.S. Average: | 273.5 |
Property crime rate in 2010
| Port St. Lucie: | 185.2 |
| U.S. Average: | 276.4 |
Property crime rate in 2009
| Port St. Lucie: | 212.7 |
| U.S. Average: | 285.6 |
Property crime rate in 2008
| Port St. Lucie: | 234.9 |
| U.S. Average: | 302.2 |
Property crime rate in 2007
| Port St. Lucie: | 193.4 |
| U.S. Average: | 309.2 |
Property crime rate in 2006
| Port St. Lucie: | 225.5 |
| U.S. Average: | 317.3 |
Property crime rate in 2005
| Port St. Lucie: | 187.5 |
| U.S. Average: | 322.3 |

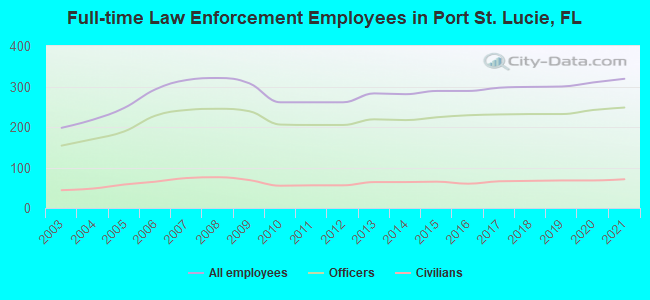
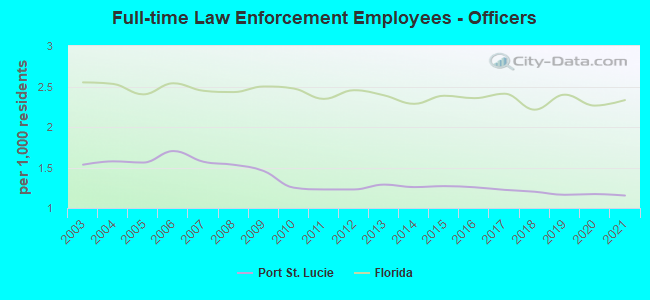
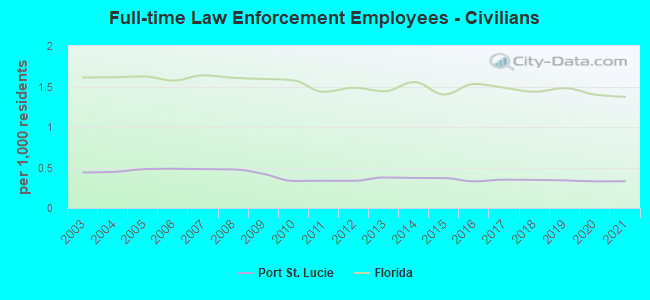
Full-time law enforcement employees in 2021, including police officers: 319 (248 officers - 206 male; 42 female).
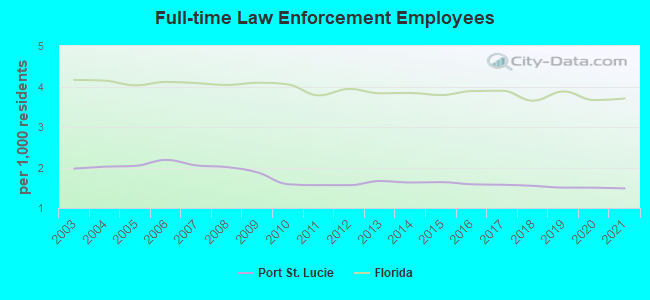
| Officers per 1,000 residents here: | 1.15 |
| Florida average: | 2.33 |
Full-time law enforcement employees in 2020, including police officers: 310 (242 officers - 201 male; 41 female).
| Officers per 1,000 residents here: | 1.17 |
| Florida average: | 2.26 |
Full-time law enforcement employees in 2019, including police officers: 300 (232 officers - 195 male; 37 female).
| Officers per 1,000 residents here: | 1.16 |
| Florida average: | 2.40 |
Full-time law enforcement employees in 2018, including police officers: 299 (232 officers - 197 male; 35 female).
| Officers per 1,000 residents here: | 1.20 |
| Florida average: | 2.21 |
Full-time law enforcement employees in 2017, including police officers: 297 (231 officers - 195 male; 36 female).
| Officers per 1,000 residents here: | 1.22 |
| Florida average: | 2.41 |
Full-time law enforcement employees in 2016, including police officers: 289 (229 officers - 195 male; 34 female).
| Officers per 1,000 residents here: | 1.26 |
| Florida average: | 2.36 |
Full-time law enforcement employees in 2015, including police officers: 289 (224 officers - 190 male; 34 female).
| Officers per 1,000 residents here: | 1.27 |
| Florida average: | 2.39 |
Full-time law enforcement employees in 2014, including police officers: 281 (217 officers - 184 male; 33 female).
| Officers per 1,000 residents here: | 1.26 |
| Florida average: | 2.29 |
Full-time law enforcement employees in 2013, including police officers: 283 (219 officers - 188 male; 31 female).
| Officers per 1,000 residents here: | 1.29 |
| Florida average: | 2.39 |
Full-time law enforcement employees in 2011, including police officers: 261 (205 officers - 181 male; 24 female).
| Officers per 1,000 residents here: | 1.23 |
| Florida average: | 2.35 |
Full-time law enforcement employees in 2010, including police officers: 261 (206 officers - 183 male; 23 female).
| Officers per 1,000 residents here: | 1.25 |
| Florida average: | 2.47 |
Full-time law enforcement employees in 2009, including police officers: 308 (239 officers - 207 male; 32 female).
| Officers per 1,000 residents here: | 1.46 |
| Florida average: | 2.50 |
Full-time law enforcement employees in 2008, including police officers: 321 (245 officers - 211 male; 34 female).
| Officers per 1,000 residents here: | 1.53 |
| Florida average: | 2.43 |
Full-time law enforcement employees in 2007, including police officers: 316 (242 officers - 209 male; 33 female).
| Officers per 1,000 residents here: | 1.57 |
| Florida average: | 2.45 |
Full-time law enforcement employees in 2006, including police officers: 293 (228 officers - 201 male; 27 female).
| Officers per 1,000 residents here: | 1.70 |
| Florida average: | 2.54 |
Full-time law enforcement employees in 2005, including police officers: 247 (189 officers - 170 male; 19 female).
| Officers per 1,000 residents here: | 1.56 |
| Florida average: | 2.40 |
Full-time law enforcement employees in 2004, including police officers: 218 (170 officers - 153 male; 17 female).
| Officers per 1,000 residents here: | 1.58 |
| Florida average: | 2.53 |
Full-time law enforcement employees in 2003, including police officers: 198 (154 officers - 140 male; 14 female).
| Officers per 1,000 residents here: | 1.53 |
| Florida average: | 2.55 |