Crime rate in Raleigh, North Carolina (NC): murders, rapes, robberies, assaults, burglaries, thefts, auto thefts, arson, law enforcement employees, police officers, crime map
Crime rate in Raleigh, NC
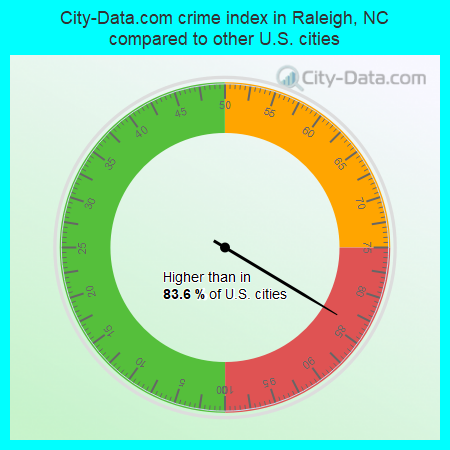
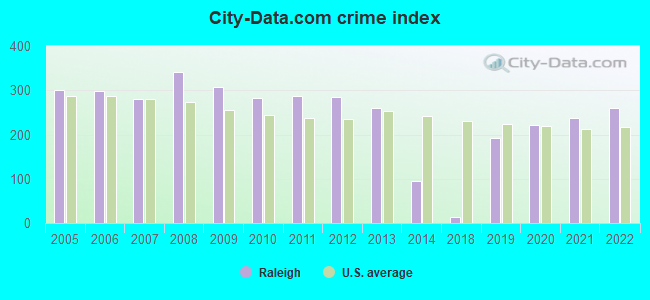
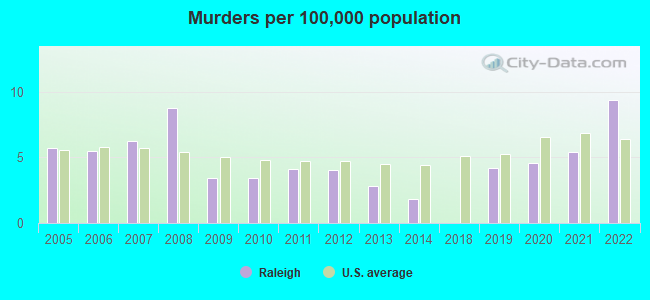
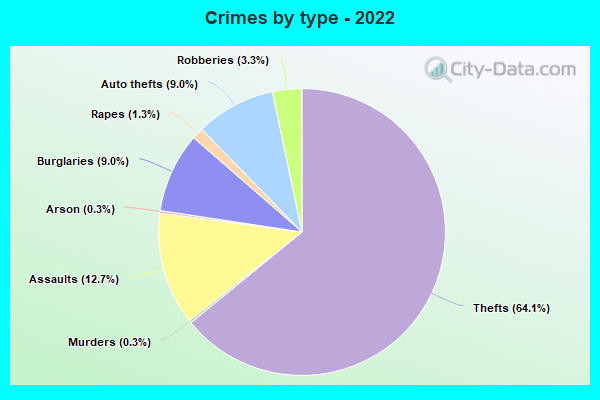
The 2022 crime rate in Raleigh, NC is 260 (City-Data.com crime index), which is about the average for the U.S. cities. It was higher than in 83.6% U.S. cities. The 2022 Raleigh crime rate rose by 9% compared to 2021. The number of homicides stood at 44 - an increase of 18 compared to 2021. In the last 5 years Raleigh has seen rise of violent crime and rise of property crime.See how dangerous Raleigh, NC is compared to the nearest cities:
(Note: Higher means more crime)
(Note: Higher means more crime)
| Raleigh: | 259.5 |
| Garner: | 277.2 |
| Knightdale: | 171.3 |
| Cary: | 74.0 |
| Morrisville: | 135.4 |
| Rolesville: | 52.2 |
| Wake Forest: | 81.8 |
| Apex: | 73.4 |
| Holly Springs: | 68.6 |
The City-Data.com crime index weighs serious crimes and violent crimes more heavily. Higher means more crime, U.S. average is 246.1. It adjusts for the number of visitors and daily workers commuting into cities.
- means the value is smaller than the state average.- means the value is about the same as the state average.
- means the value is bigger than the state average.
- means the value is much bigger than the state average.
According to our research of North Carolina and other state lists, there were 2,154 registered sex offenders living in Raleigh, North Carolina as of April 16, 2024.
The ratio of all residents to sex offenders in Raleigh is 213 to 1.
Violent crime rate in 2022
| Raleigh: | 282.4 |
| U.S. Average: | 219.8 |
Violent crime rate in 2021
| Raleigh: | 259.3 |
| U.S. Average: | 224.8 |
Violent crime rate in 2020
| Raleigh: | 223.5 |
| U.S. Average: | 228.2 |
Violent crime rate in 2019
| Raleigh: | 180.0 |
| U.S. Average: | 219.9 |
Violent crime rate in 2018
| Raleigh: | 12.9 |
| U.S. Average: | 221.2 |
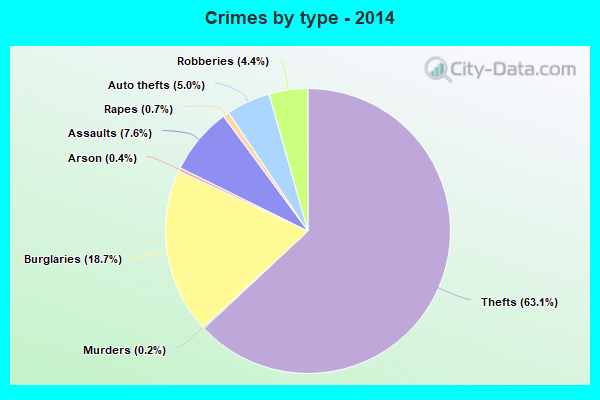
Violent crime rate in 2014
| Raleigh: | 82.7 |
| U.S. Average: | 211.1 |
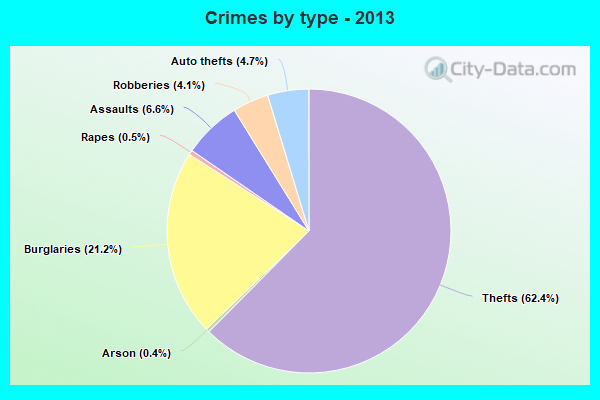
Violent crime rate in 2013
| Raleigh: | 209.6 |
| U.S. Average: | 214.2 |
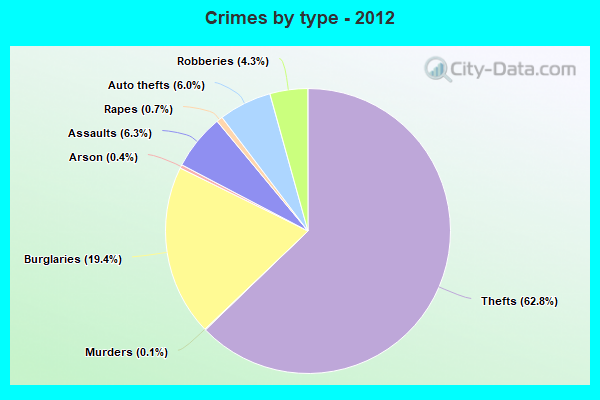
Violent crime rate in 2012
| Raleigh: | 231.1 |
| U.S. Average: | 187.4 |
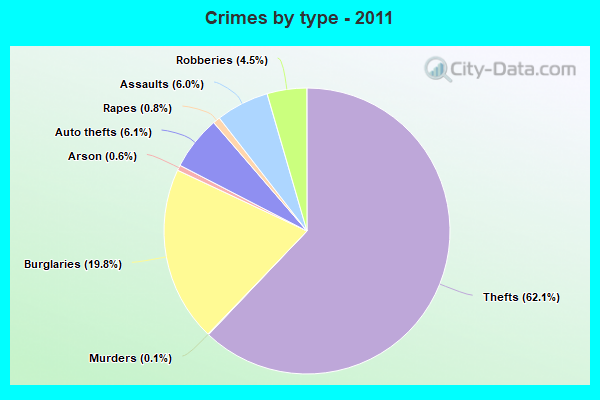
Violent crime rate in 2011
| Raleigh: | 232.5 |
| U.S. Average: | 187.1 |
Violent crime rate in 2010
| Raleigh: | 232.9 |
| U.S. Average: | 195.7 |
Violent crime rate in 2009
| Raleigh: | 263.8 |
| U.S. Average: | 208.9 |
Violent crime rate in 2008
| Raleigh: | 314.2 |
| U.S. Average: | 222.5 |
Violent crime rate in 2007
| Raleigh: | 256.0 |
| U.S. Average: | 229.1 |
Violent crime rate in 2006
| Raleigh: | 283.0 |
| U.S. Average: | 232.6 |
Violent crime rate in 2005
| Raleigh: | 274.1 |
| U.S. Average: | 227.0 |
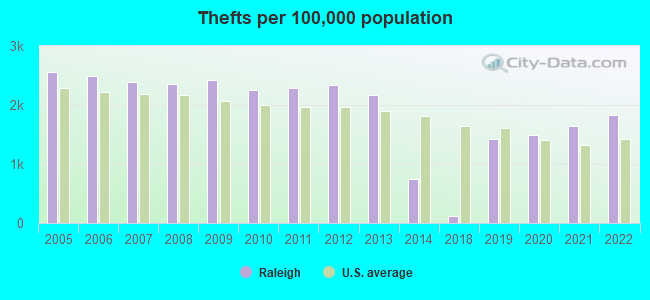
Property crime rate in 2022
| Raleigh: | 180.7 |
| U.S. Average: | 166.5 |
Property crime rate in 2021
| Raleigh: | 171.2 |
| U.S. Average: | 157.8 |
Property crime rate in 2020
| Raleigh: | 171.3 |
| U.S. Average: | 169.6 |
Property crime rate in 2019
| Raleigh: | 153.9 |
| U.S. Average: | 179.7 |
Property crime rate in 2018
| Raleigh: | 12.9 |
| U.S. Average: | 190.2 |
Property crime rate in 2014
| Raleigh: | 90.7 |
| U.S. Average: | 230.8 |
Property crime rate in 2013
| Raleigh: | 280.0 |
| U.S. Average: | 250.4 |
Property crime rate in 2012
| Raleigh: | 294.2 |
| U.S. Average: | 267.3 |
Property crime rate in 2011
| Raleigh: | 293.7 |
| U.S. Average: | 273.5 |
Property crime rate in 2010
| Raleigh: | 294.6 |
| U.S. Average: | 276.4 |
Property crime rate in 2009
| Raleigh: | 307.5 |
| U.S. Average: | 285.6 |
Property crime rate in 2008
| Raleigh: | 313.9 |
| U.S. Average: | 302.2 |
Property crime rate in 2007
| Raleigh: | 267.6 |
| U.S. Average: | 309.2 |
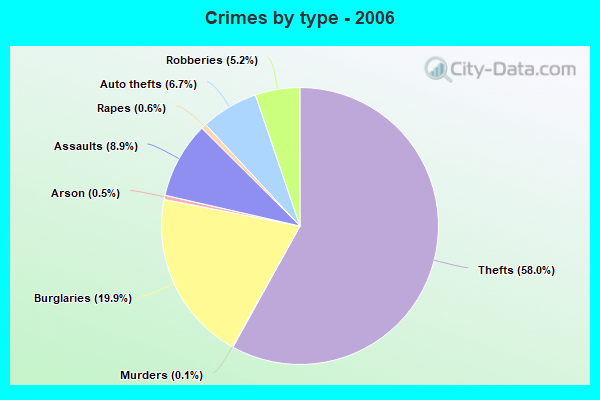
Property crime rate in 2006
| Raleigh: | 280.9 |
| U.S. Average: | 317.3 |
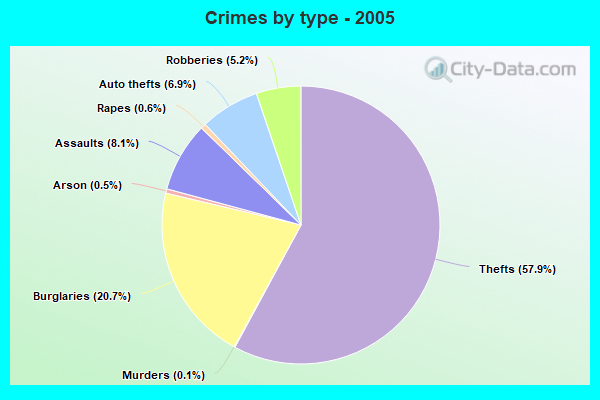
Property crime rate in 2005
| Raleigh: | 295.5 |
| U.S. Average: | 322.3 |
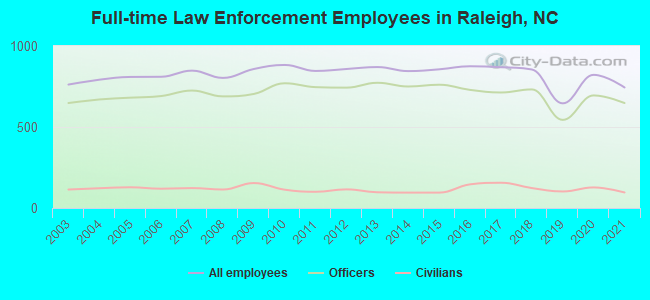
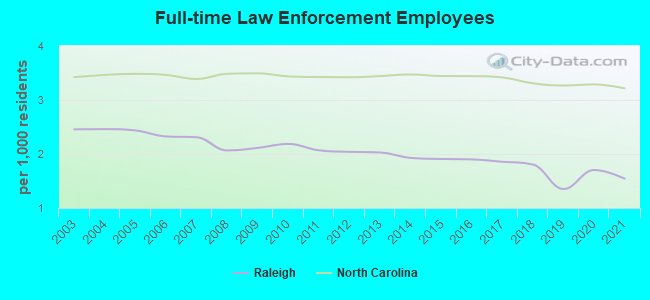
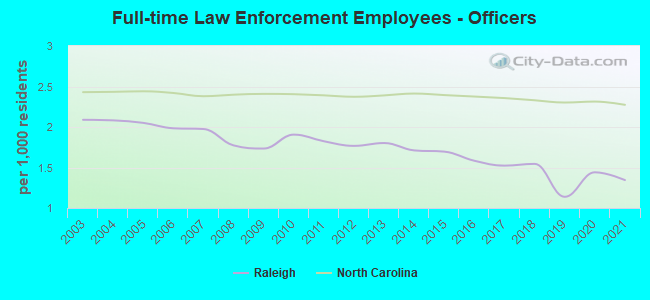
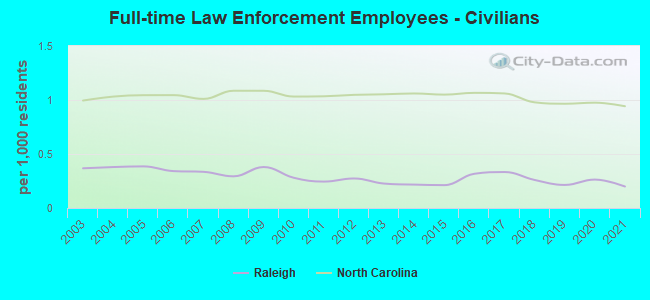
Full-time law enforcement employees in 2021, including police officers: 744 (648 officers - 578 male; 70 female).
| Officers per 1,000 residents here: | 1.34 |
| North Carolina average: | 2.27 |
Full-time law enforcement employees in 2020, including police officers: 822 (695 officers - 617 male; 78 female).
| Officers per 1,000 residents here: | 1.44 |
| North Carolina average: | 2.31 |
Full-time law enforcement employees in 2019, including police officers: 646 (544 officers - 462 male; 82 female).
| Officers per 1,000 residents here: | 1.14 |
| North Carolina average: | 2.30 |
Full-time law enforcement employees in 2018, including police officers: 855 (732 officers - 656 male; 76 female).
| Officers per 1,000 residents here: | 1.55 |
| North Carolina average: | 2.33 |
Full-time law enforcement employees in 2017, including police officers: 869 (713 officers - 644 male; 69 female).
| Officers per 1,000 residents here: | 1.52 |
| North Carolina average: | 2.36 |
Full-time law enforcement employees in 2016, including police officers: 875 (729 officers - 658 male; 71 female).
| Officers per 1,000 residents here: | 1.58 |
| North Carolina average: | 2.38 |
Full-time law enforcement employees in 2015, including police officers: 856 (761 officers - 685 male; 76 female).
| Officers per 1,000 residents here: | 1.70 |
| North Carolina average: | 2.39 |
Full-time law enforcement employees in 2014, including police officers: 845 (750 officers - 677 male; 73 female).
| Officers per 1,000 residents here: | 1.71 |
| North Carolina average: | 2.41 |
Full-time law enforcement employees in 2013, including police officers: 870 (773 officers - 689 male; 84 female).
| Officers per 1,000 residents here: | 1.80 |
| North Carolina average: | 2.39 |
Full-time law enforcement employees in 2012, including police officers: 858 (743 officers - 665 male; 78 female).
| Officers per 1,000 residents here: | 1.77 |
| North Carolina average: | 2.37 |
Full-time law enforcement employees in 2011, including police officers: 846 (746 officers - 662 male; 84 female).
| Officers per 1,000 residents here: | 1.82 |
| North Carolina average: | 2.39 |
Full-time law enforcement employees in 2010, including police officers: 883 (770 officers - 680 male; 90 female).
| Officers per 1,000 residents here: | 1.91 |
| North Carolina average: | 2.40 |
Full-time law enforcement employees in 2009, including police officers: 858 (704 officers - 625 male; 79 female).
| Officers per 1,000 residents here: | 1.73 |
| North Carolina average: | 2.41 |
Full-time law enforcement employees in 2008, including police officers: 803 (689 officers - 604 male; 85 female).
| Officers per 1,000 residents here: | 1.77 |
| North Carolina average: | 2.40 |
Full-time law enforcement employees in 2007, including police officers: 848 (725 officers - 633 male; 92 female).
| Officers per 1,000 residents here: | 1.97 |
| North Carolina average: | 2.38 |
Full-time law enforcement employees in 2006, including police officers: 810 (691 officers - 613 male; 78 female).
| Officers per 1,000 residents here: | 1.98 |
| North Carolina average: | 2.42 |
Full-time law enforcement employees in 2005, including police officers: 809 (681 officers - 607 male; 74 female).
| Officers per 1,000 residents here: | 2.05 |
| North Carolina average: | 2.44 |
Full-time law enforcement employees in 2004, including police officers: 792 (670 officers - 604 male; 66 female).
| Officers per 1,000 residents here: | 2.08 |
| North Carolina average: | 2.43 |
Full-time law enforcement employees in 2003, including police officers: 762 (648 officers - 585 male; 63 female).
| Officers per 1,000 residents here: | 2.09 |
| North Carolina average: | 2.43 |
Zip codes: 27587, 27601, 27605, 27608, 27609, 27612, 27613, 27614, 27615, 27616.