Crime rate in Riverside, California (CA): murders, rapes, robberies, assaults, burglaries, thefts, auto thefts, arson, law enforcement employees, police officers, crime map
Crime rate in Riverside, CA
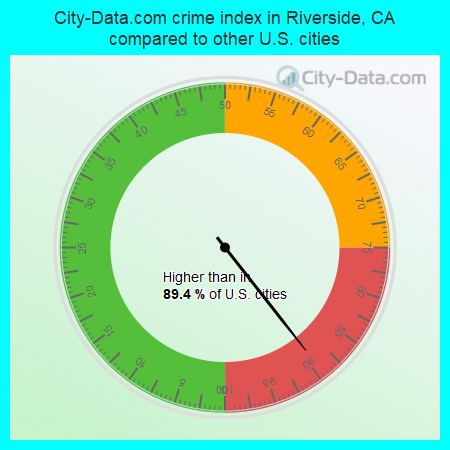
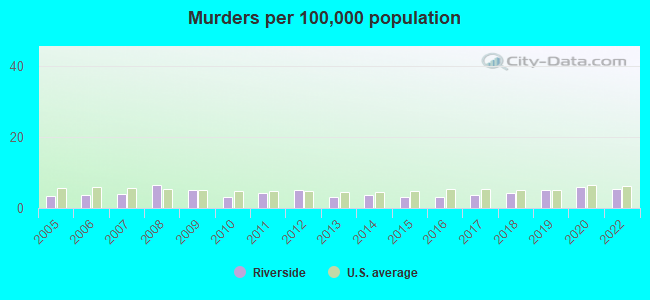
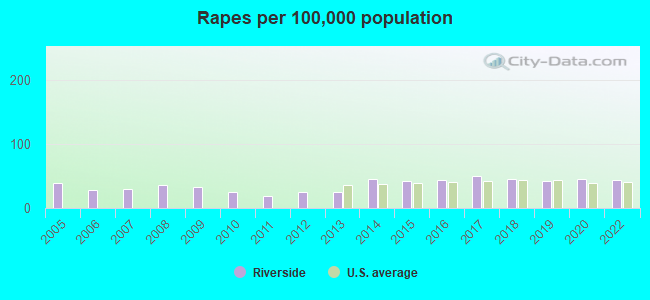
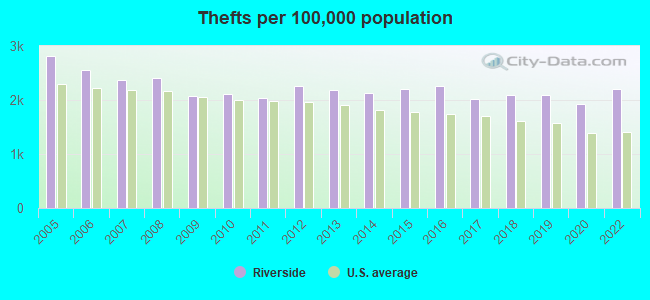
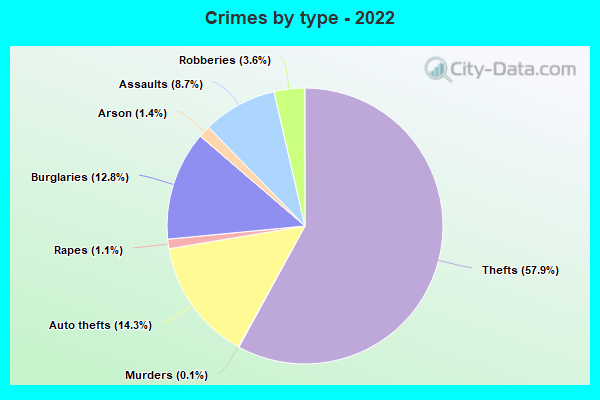
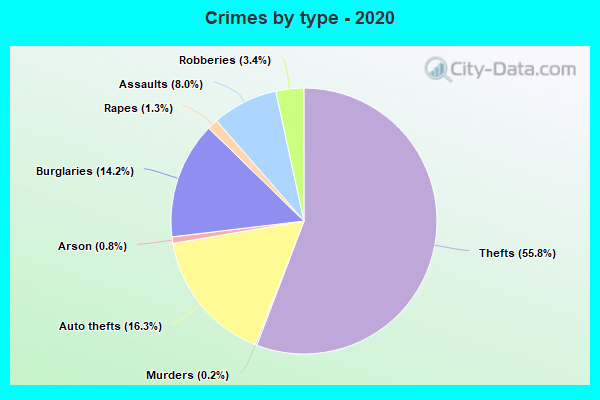
The 2022 crime rate in Riverside, CA is 318 (City-Data.com crime index), which is 1.3 times higher than the U.S. average. It was higher than in 89.4% U.S. cities. The 2022 Riverside crime rate rose by 8% compared to 2020. The number of homicides stood at 17 - a decrease of 3 compared to 2020. In the last 5 years Riverside has seen rise of violent crime and increasing property crime.See how dangerous Riverside, CA is compared to the nearest cities:
(Note: Higher means more crime)
(Note: Higher means more crime)
| Riverside: | 318.4 |
| Grand Terrace: | 231.2 |
| Colton: | 247.8 |
| Norco: | 186.7 |
| Moreno Valley: | 205.9 |
| Eastvale: | 121.6 |
| Loma Linda: | 205.5 |
| Fontana: | 158.7 |
| Corona: | 192.0 |
The City-Data.com crime index weighs serious crimes and violent crimes more heavily. Higher means more crime, U.S. average is 246.1. It adjusts for the number of visitors and daily workers commuting into cities.
- means the value is smaller than the state average.- means the value is about the same as the state average.
- means the value is bigger than the state average.
- means the value is much bigger than the state average.
According to our research of California and other state lists, there were 606 registered sex offenders living in Riverside, California as of April 24, 2024.
The ratio of all residents to sex offenders in Riverside is 536 to 1.
Violent crime rate in 2022
| Riverside: | 287.8 |
| U.S. Average: | 219.8 |
Violent crime rate in 2020
| Riverside: | 254.7 |
| U.S. Average: | 228.2 |
Violent crime rate in 2019
| Riverside: | 281.5 |
| U.S. Average: | 219.9 |
Violent crime rate in 2018
| Riverside: | 283.7 |
| U.S. Average: | 221.2 |
Violent crime rate in 2017
| Riverside: | 285.2 |
| U.S. Average: | 226.2 |
Violent crime rate in 2016
| Riverside: | 290.7 |
| U.S. Average: | 227.3 |
Violent crime rate in 2015
| Riverside: | 248.9 |
| U.S. Average: | 219.3 |
Violent crime rate in 2014
| Riverside: | 244.6 |
| U.S. Average: | 211.1 |
Violent crime rate in 2013
| Riverside: | 227.2 |
| U.S. Average: | 214.2 |
Violent crime rate in 2012
| Riverside: | 241.3 |
| U.S. Average: | 187.4 |
Violent crime rate in 2011
| Riverside: | 228.7 |
| U.S. Average: | 187.1 |
Violent crime rate in 2010
| Riverside: | 255.5 |
| U.S. Average: | 195.7 |
Violent crime rate in 2009
| Riverside: | 279.8 |
| U.S. Average: | 208.9 |
Violent crime rate in 2008
| Riverside: | 348.7 |
| U.S. Average: | 222.5 |
Violent crime rate in 2007
| Riverside: | 301.5 |
| U.S. Average: | 229.1 |
Violent crime rate in 2006
| Riverside: | 325.1 |
| U.S. Average: | 232.6 |
Violent crime rate in 2005
| Riverside: | 322.7 |
| U.S. Average: | 227.0 |
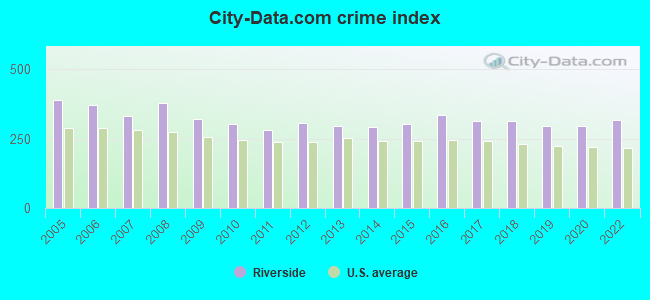
Property crime rate in 2022
| Riverside: | 289.9 |
| U.S. Average: | 166.5 |
Property crime rate in 2020
| Riverside: | 279.1 |
| U.S. Average: | 169.6 |
Property crime rate in 2019
| Riverside: | 250.2 |
| U.S. Average: | 179.7 |
Property crime rate in 2018
| Riverside: | 276.8 |
| U.S. Average: | 190.2 |
Property crime rate in 2017
| Riverside: | 282.2 |
| U.S. Average: | 206.4 |
Property crime rate in 2016
| Riverside: | 323.2 |
| U.S. Average: | 216.6 |
Property crime rate in 2015
| Riverside: | 293.1 |
| U.S. Average: | 221.5 |
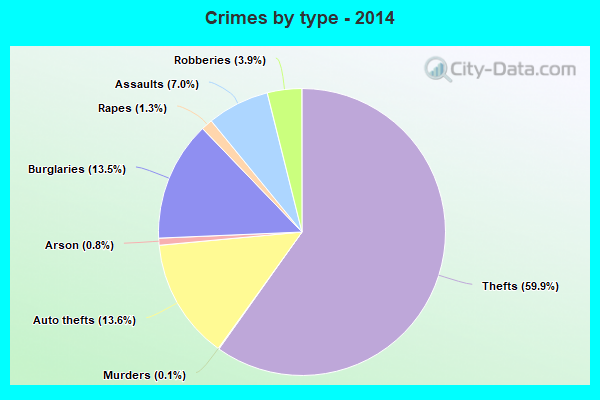
Property crime rate in 2014
| Riverside: | 274.5 |
| U.S. Average: | 230.8 |
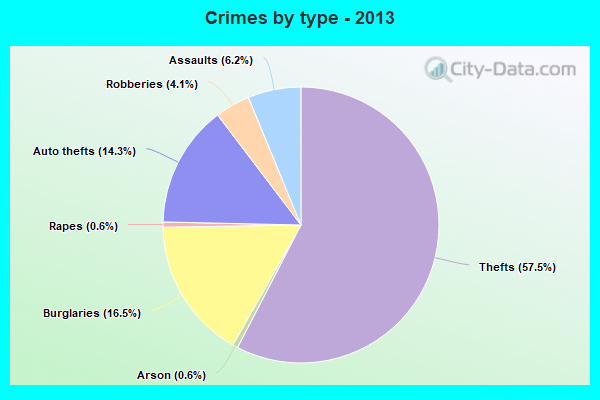
Property crime rate in 2013
| Riverside: | 315.7 |
| U.S. Average: | 250.4 |
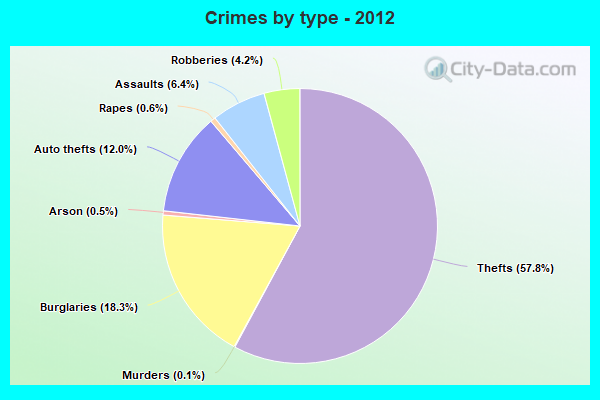
Property crime rate in 2012
| Riverside: | 327.1 |
| U.S. Average: | 267.3 |
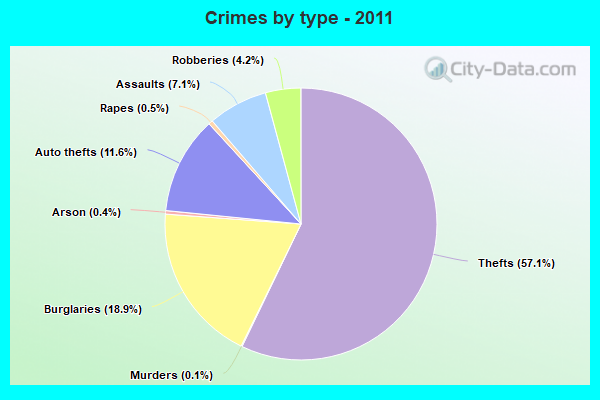
Property crime rate in 2011
| Riverside: | 299.5 |
| U.S. Average: | 273.5 |
Property crime rate in 2010
| Riverside: | 314.1 |
| U.S. Average: | 276.4 |
Property crime rate in 2009
| Riverside: | 305.3 |
| U.S. Average: | 285.6 |
Property crime rate in 2008
| Riverside: | 349.5 |
| U.S. Average: | 302.2 |
Property crime rate in 2007
| Riverside: | 321.3 |
| U.S. Average: | 309.2 |
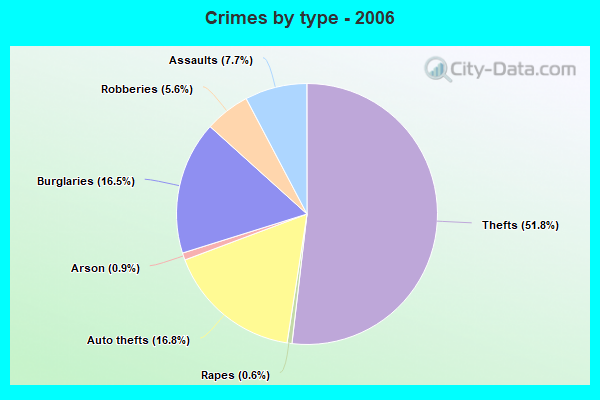
Property crime rate in 2006
| Riverside: | 369.9 |
| U.S. Average: | 317.3 |
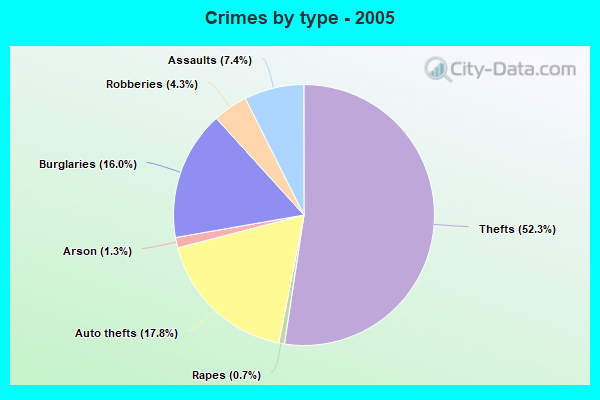
Property crime rate in 2005
| Riverside: | 407.2 |
| U.S. Average: | 322.3 |
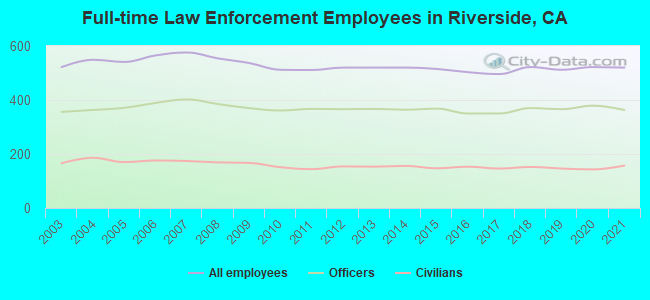
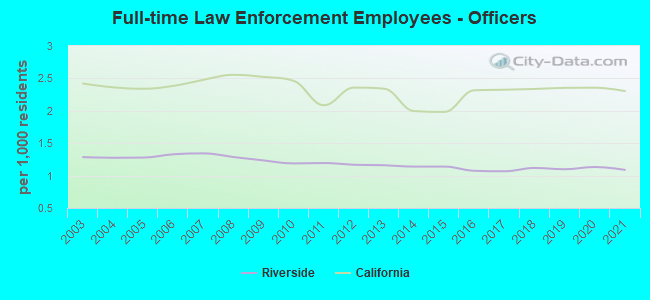
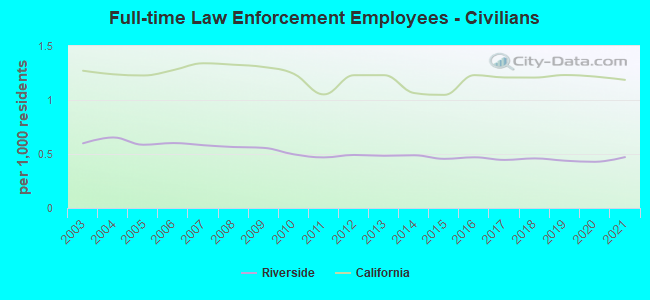
Full-time law enforcement employees in 2021, including police officers: 520 (363 officers - 318 male; 45 female).
| Officers per 1,000 residents here: | 1.09 |
| California average: | 2.30 |
Full-time law enforcement employees in 2020, including police officers: 522 (379 officers - 334 male; 45 female).
| Officers per 1,000 residents here: | 1.13 |
| California average: | 2.36 |
Full-time law enforcement employees in 2019, including police officers: 512 (366 officers - 322 male; 44 female).
| Officers per 1,000 residents here: | 1.10 |
| California average: | 2.35 |
Full-time law enforcement employees in 2018, including police officers: 522 (370 officers - 321 male; 49 female).
| Officers per 1,000 residents here: | 1.12 |
| California average: | 2.34 |
Full-time law enforcement employees in 2017, including police officers: 496 (350 officers - 310 male; 40 female).
| Officers per 1,000 residents here: | 1.07 |
| California average: | 2.32 |
Full-time law enforcement employees in 2016, including police officers: 503 (350 officers - 312 male; 38 female).
| Officers per 1,000 residents here: | 1.07 |
| California average: | 2.32 |
Full-time law enforcement employees in 2015, including police officers: 515 (368 officers - 326 male; 42 female).
| Officers per 1,000 residents here: | 1.14 |
| California average: | 1.98 |
Full-time law enforcement employees in 2014, including police officers: 520 (364 officers - 324 male; 40 female).
| Officers per 1,000 residents here: | 1.14 |
| California average: | 2.00 |
Full-time law enforcement employees in 2013, including police officers: 520 (367 officers - 329 male; 38 female).
| Officers per 1,000 residents here: | 1.16 |
| California average: | 2.34 |
Full-time law enforcement employees in 2012, including police officers: 520 (366 officers - 328 male; 38 female).
| Officers per 1,000 residents here: | 1.17 |
| California average: | 2.36 |
Full-time law enforcement employees in 2011, including police officers: 511 (367 officers - 328 male; 39 female).
| Officers per 1,000 residents here: | 1.19 |
| California average: | 2.09 |
Full-time law enforcement employees in 2010, including police officers: 512 (361 officers - 324 male; 37 female).
| Officers per 1,000 residents here: | 1.19 |
| California average: | 2.46 |
Full-time law enforcement employees in 2009, including police officers: 537 (370 officers - 333 male; 37 female).
| Officers per 1,000 residents here: | 1.23 |
| California average: | 2.52 |
Full-time law enforcement employees in 2008, including police officers: 554 (385 officers - 349 male; 36 female).
| Officers per 1,000 residents here: | 1.29 |
| California average: | 2.55 |
Full-time law enforcement employees in 2007, including police officers: 576 (402 officers - 361 male; 41 female).
| Officers per 1,000 residents here: | 1.34 |
| California average: | 2.48 |
Full-time law enforcement employees in 2006, including police officers: 565 (389 officers - 354 male; 35 female).
| Officers per 1,000 residents here: | 1.33 |
| California average: | 2.38 |
Full-time law enforcement employees in 2005, including police officers: 541 (371 officers - 338 male; 33 female).
| Officers per 1,000 residents here: | 1.28 |
| California average: | 2.34 |
Full-time law enforcement employees in 2004, including police officers: 549 (363 officers - 330 male; 33 female).
| Officers per 1,000 residents here: | 1.27 |
| California average: | 2.36 |
Full-time law enforcement employees in 2003, including police officers: 522 (356 officers - 326 male; 30 female).
| Officers per 1,000 residents here: | 1.28 |
| California average: | 2.42 |


Zip codes: 92506.