Crime rate in San Jose, California (CA): murders, rapes, robberies, assaults, burglaries, thefts, auto thefts, arson, law enforcement employees, police officers, crime map
Crime rate in San Jose, CA
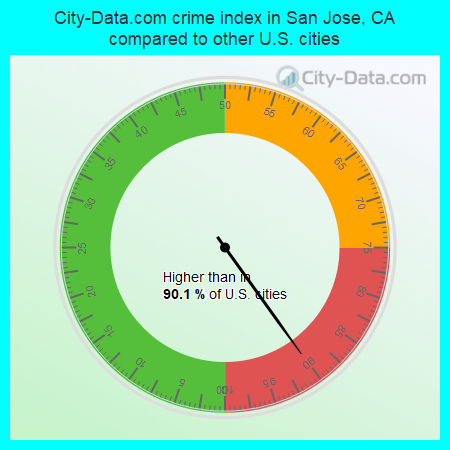
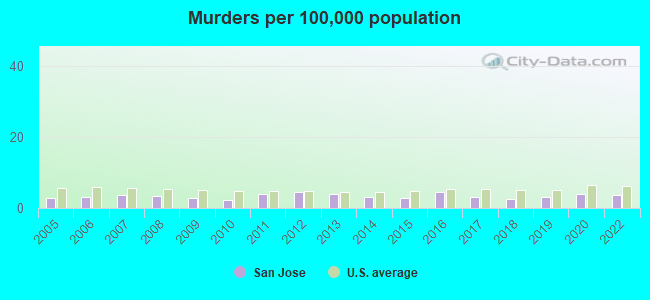
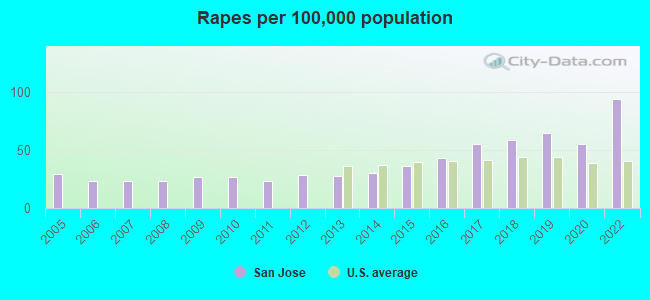
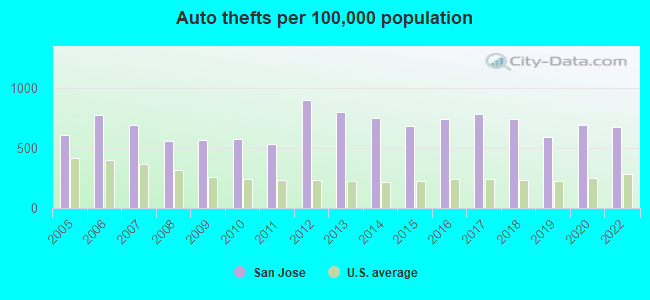
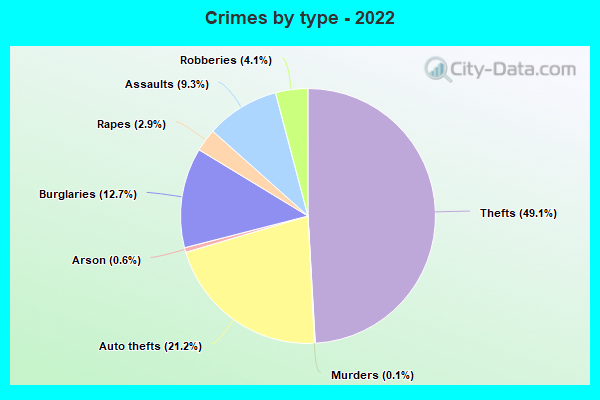
The 2022 crime rate in San Jose, CA is 327 (City-Data.com crime index), which is 1.3 times higher than the U.S. average. It was higher than in 90.1% U.S. cities. The 2022 San Jose crime rate rose by 22% compared to 2020. The number of homicides stood at 35 - a decrease of 5 compared to 2020. In the last 5 years San Jose has seen rise of violent crime and decline of property crime.See how dangerous San Jose, CA is compared to the nearest cities:
(Note: Higher means more crime)
(Note: Higher means more crime)
| San Jose: | 326.6 |
| Campbell: | 276.0 |
| Santa Clara: | 262.9 |
| Los Gatos: | 138.9 |
| Monte Sereno: | 76.8 |
| Saratoga: | 60.8 |
| Milpitas: | 253.3 |
| Cupertino: | 111.4 |
| Sunnyvale: | 189.1 |
The City-Data.com crime index weighs serious crimes and violent crimes more heavily. Higher means more crime, U.S. average is 246.1. It adjusts for the number of visitors and daily workers commuting into cities.
- means the value is smaller than the state average.- means the value is about the same as the state average.
- means the value is bigger than the state average.
- means the value is much bigger than the state average.
According to our research of California and other state lists, there were 1,799 registered sex offenders living in San Jose, California as of April 16, 2024.
The ratio of all residents to sex offenders in San Jose is 570 to 1.
Violent crime rate in 2022
| San Jose: | 315.9 |
| U.S. Average: | 219.8 |
Violent crime rate in 2020
| San Jose: | 245.8 |
| U.S. Average: | 228.2 |
Violent crime rate in 2019
| San Jose: | 256.1 |
| U.S. Average: | 219.9 |
Violent crime rate in 2018
| San Jose: | 245.5 |
| U.S. Average: | 221.2 |
Violent crime rate in 2017
| San Jose: | 234.0 |
| U.S. Average: | 226.2 |
Violent crime rate in 2016
| San Jose: | 215.0 |
| U.S. Average: | 227.3 |
Violent crime rate in 2015
| San Jose: | 187.4 |
| U.S. Average: | 219.3 |
Violent crime rate in 2014
| San Jose: | 180.5 |
| U.S. Average: | 211.1 |
Violent crime rate in 2013
| San Jose: | 181.4 |
| U.S. Average: | 214.2 |
Violent crime rate in 2012
| San Jose: | 202.9 |
| U.S. Average: | 187.4 |
Violent crime rate in 2011
| San Jose: | 185.4 |
| U.S. Average: | 187.1 |
Violent crime rate in 2010
| San Jose: | 186.5 |
| U.S. Average: | 195.7 |
Violent crime rate in 2009
| San Jose: | 198.2 |
| U.S. Average: | 208.9 |
Violent crime rate in 2008
| San Jose: | 209.3 |
| U.S. Average: | 222.5 |
Violent crime rate in 2007
| San Jose: | 206.4 |
| U.S. Average: | 229.1 |
Violent crime rate in 2006
| San Jose: | 198.7 |
| U.S. Average: | 232.6 |
Violent crime rate in 2005
| San Jose: | 199.2 |
| U.S. Average: | 227.0 |
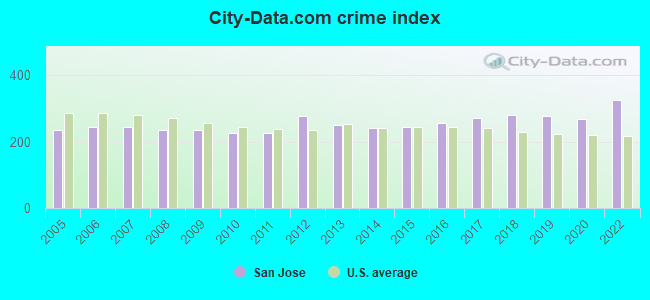
Property crime rate in 2022
| San Jose: | 261.0 |
| U.S. Average: | 166.5 |
Property crime rate in 2020
| San Jose: | 243.4 |
| U.S. Average: | 169.6 |
Property crime rate in 2019
| San Jose: | 239.2 |
| U.S. Average: | 179.7 |
Property crime rate in 2018
| San Jose: | 261.5 |
| U.S. Average: | 190.2 |
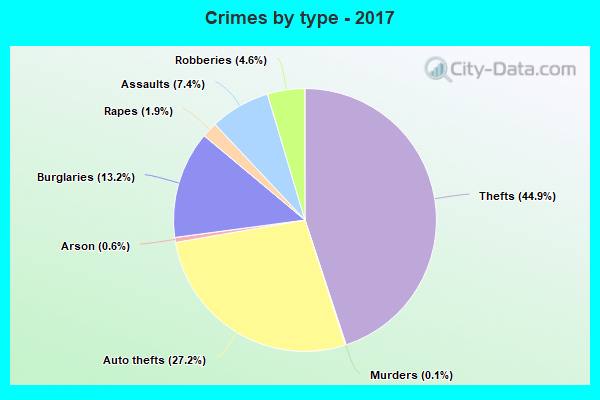
Property crime rate in 2017
| San Jose: | 256.6 |
| U.S. Average: | 206.4 |
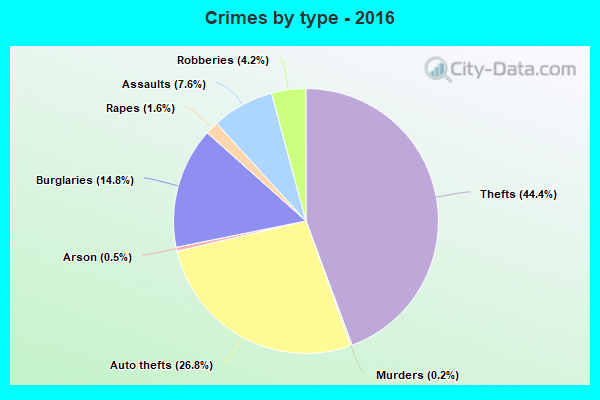
Property crime rate in 2016
| San Jose: | 254.0 |
| U.S. Average: | 216.6 |
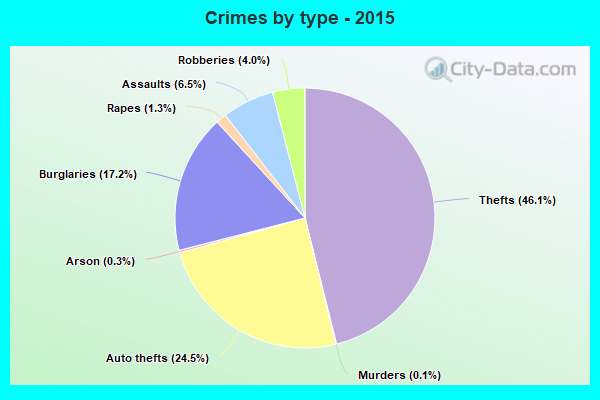
Property crime rate in 2015
| San Jose: | 260.4 |
| U.S. Average: | 221.5 |
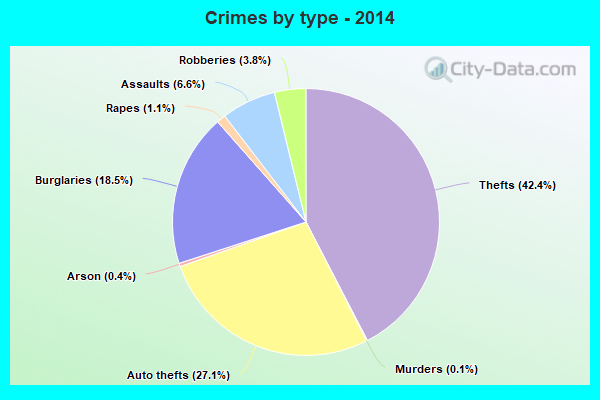
Property crime rate in 2014
| San Jose: | 273.3 |
| U.S. Average: | 230.8 |
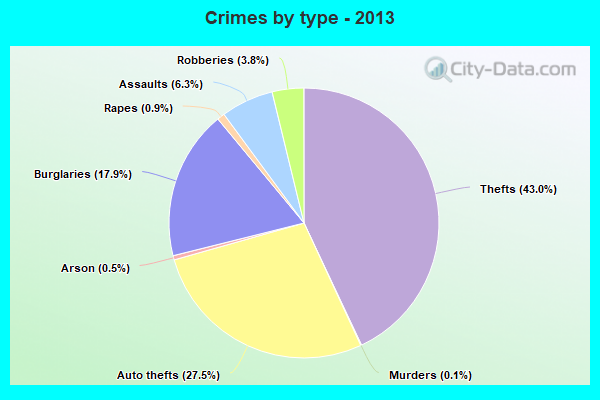
Property crime rate in 2013
| San Jose: | 286.7 |
| U.S. Average: | 250.4 |
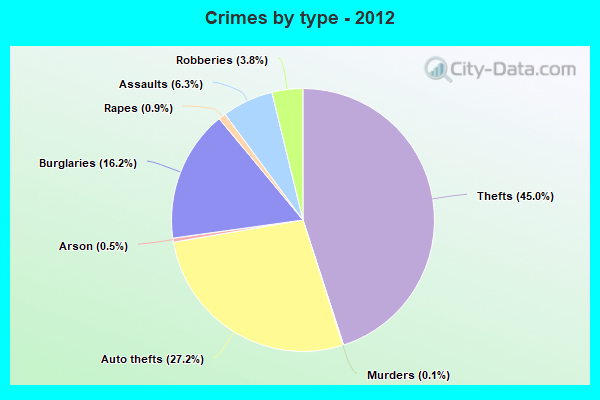
Property crime rate in 2012
| San Jose: | 315.4 |
| U.S. Average: | 267.3 |
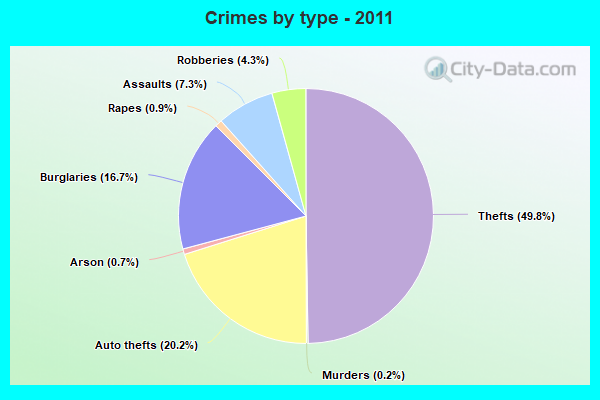
Property crime rate in 2011
| San Jose: | 234.5 |
| U.S. Average: | 273.5 |
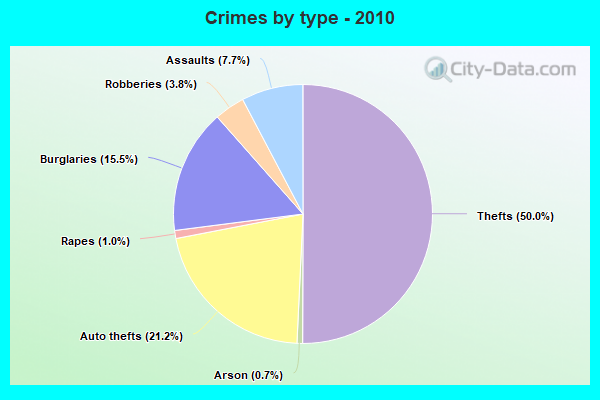
Property crime rate in 2010
| San Jose: | 236.4 |
| U.S. Average: | 276.4 |
Property crime rate in 2009
| San Jose: | 234.5 |
| U.S. Average: | 285.6 |
Property crime rate in 2008
| San Jose: | 228.1 |
| U.S. Average: | 302.2 |
Property crime rate in 2007
| San Jose: | 254.4 |
| U.S. Average: | 309.2 |
Property crime rate in 2006
| San Jose: | 266.3 |
| U.S. Average: | 317.3 |
Property crime rate in 2005
| San Jose: | 239.6 |
| U.S. Average: | 322.3 |

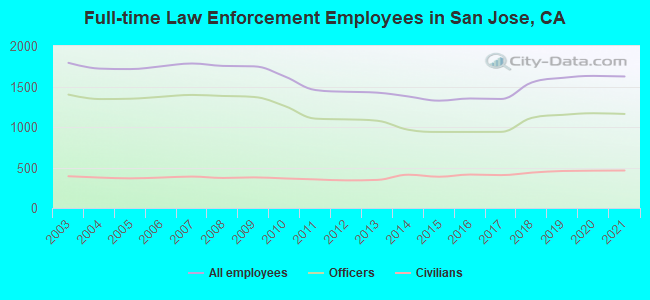
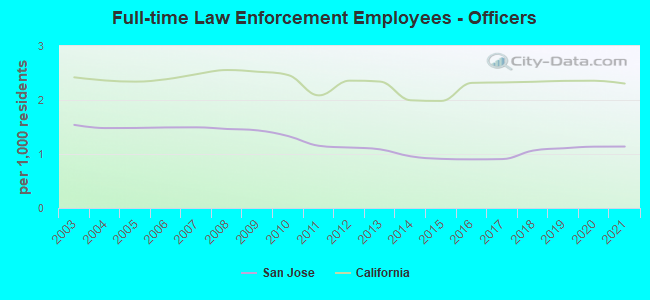
Full-time law enforcement employees in 2021, including police officers: 1,624 (1,161 officers - 1,009 male; 152 female).
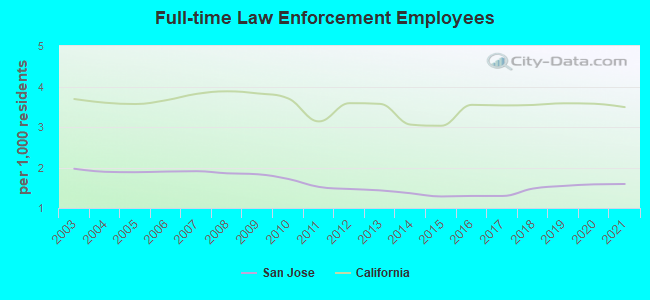
| Officers per 1,000 residents here: | 1.14 |
| California average: | 2.30 |
Full-time law enforcement employees in 2020, including police officers: 1,631 (1,170 officers - 1,032 male; 138 female).
| Officers per 1,000 residents here: | 1.14 |
| California average: | 2.36 |
Full-time law enforcement employees in 2019, including police officers: 1,607 (1,150 officers - 1,020 male; 130 female).
| Officers per 1,000 residents here: | 1.11 |
| California average: | 2.35 |
Full-time law enforcement employees in 2018, including police officers: 1,550 (1,113 officers - 1,002 male; 111 female).
| Officers per 1,000 residents here: | 1.06 |
| California average: | 2.34 |
Full-time law enforcement employees in 2017, including police officers: 1,346 (940 officers - 842 male; 98 female).
| Officers per 1,000 residents here: | 0.91 |
| California average: | 2.32 |
Full-time law enforcement employees in 2016, including police officers: 1,352 (939 officers - 841 male; 98 female).
| Officers per 1,000 residents here: | 0.90 |
| California average: | 2.32 |
Full-time law enforcement employees in 2015, including police officers: 1,325 (939 officers - 847 male; 92 female).
| Officers per 1,000 residents here: | 0.91 |
| California average: | 1.98 |
Full-time law enforcement employees in 2014, including police officers: 1,377 (966 officers - 875 male; 91 female).
| Officers per 1,000 residents here: | 0.96 |
| California average: | 2.00 |
Full-time law enforcement employees in 2013, including police officers: 1,424 (1,077 officers - 978 male; 99 female).
| Officers per 1,000 residents here: | 1.09 |
| California average: | 2.34 |
Full-time law enforcement employees in 2012, including police officers: 1,435 (1,094 officers - 989 male; 105 female).
| Officers per 1,000 residents here: | 1.12 |
| California average: | 2.36 |
Full-time law enforcement employees in 2011, including police officers: 1,456 (1,103 officers - 1,030 male; 73 female).
| Officers per 1,000 residents here: | 1.15 |
| California average: | 2.09 |
Full-time law enforcement employees in 2010, including police officers: 1,624 (1,259 officers - 1,135 male; 124 female).
| Officers per 1,000 residents here: | 1.33 |
| California average: | 2.46 |
Full-time law enforcement employees in 2009, including police officers: 1,749 (1,371 officers - 1,238 male; 133 female).
| Officers per 1,000 residents here: | 1.44 |
| California average: | 2.52 |
Full-time law enforcement employees in 2008, including police officers: 1,754 (1,383 officers - 1,245 male; 138 female).
| Officers per 1,000 residents here: | 1.46 |
| California average: | 2.55 |
Full-time law enforcement employees in 2007, including police officers: 1,784 (1,396 officers - 1,261 male; 135 female).
| Officers per 1,000 residents here: | 1.49 |
| California average: | 2.48 |
Full-time law enforcement employees in 2006, including police officers: 1,749 (1,373 officers - 1,241 male; 132 female).
| Officers per 1,000 residents here: | 1.49 |
| California average: | 2.38 |
Full-time law enforcement employees in 2005, including police officers: 1,715 (1,349 officers - 1,216 male; 133 female).
| Officers per 1,000 residents here: | 1.48 |
| California average: | 2.34 |
Full-time law enforcement employees in 2004, including police officers: 1,721 (1,345 officers - 1,216 male; 129 female).
| Officers per 1,000 residents here: | 1.48 |
| California average: | 2.36 |
Full-time law enforcement employees in 2003, including police officers: 1,792 (1,400 officers - 1,266 male; 134 female).
| Officers per 1,000 residents here: | 1.54 |
| California average: | 2.42 |


Zip codes: 94089, 95002, 95013, 95050, 95054, 95110, 95111, 95112, 95113, 95116, 95118, 95119, 95120, 95121, 95122, 95123, 95126, 95129, 95130, 95131, 95134, 95135, 95136, 95138, 95139, 95140, 95148.