Crime rate in Southaven, Mississippi (MS): murders, rapes, robberies, assaults, burglaries, thefts, auto thefts, arson, law enforcement employees, police officers, crime map
Crime rate in Southaven, MS
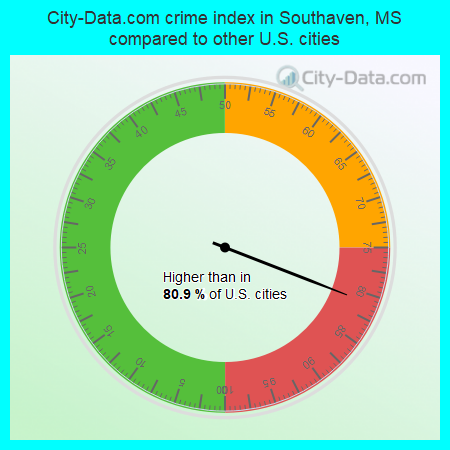
The 2022 crime rate in Southaven, MS is 236 (City-Data.com crime index), which is about the average for the U.S. cities. It was higher than in 80.9% U.S. cities. The 2022 Southaven crime rate rose by 0% compared to 2021. In the last 5 years Southaven has seen rise of violent crime and increasing property crime.See how dangerous Southaven, MS is compared to the nearest cities:
(Note: Higher means more crime)
(Note: Higher means more crime)
| Southaven: | 235.8 |
| Horn Lake: | 177.1 |
| Olive Branch: | 178.4 |
| Walls: | 68.4 |
| Hernando: | 63.8 |
| Memphis: | 1,022.4 |
| Germantown: | 111.2 |
| West Memphis: | 947.1 |
| Byhalia: | 206.7 |
The City-Data.com crime index weighs serious crimes and violent crimes more heavily. Higher means more crime, U.S. average is 246.1. It adjusts for the number of visitors and daily workers commuting into cities.
- means the value is smaller than the state average.- means the value is about the same as the state average.
- means the value is bigger than the state average.
- means the value is much bigger than the state average.
According to our research of Mississippi and other state lists, there were 67 registered sex offenders living in Southaven, Mississippi as of April 23, 2024.
The ratio of all residents to sex offenders in Southaven is 773 to 1.
The ratio of registered sex offenders to all residents in this city is lower than the state average.
Violent crime rate in 2022
| Southaven: | 139.1 |
| U.S. Average: | 219.8 |
Violent crime rate in 2021
| Southaven: | 173.2 |
| U.S. Average: | 224.8 |
Violent crime rate in 2020
| Southaven: | 127.3 |
| U.S. Average: | 228.2 |
Violent crime rate in 2019
| Southaven: | 103.2 |
| U.S. Average: | 219.9 |
Violent crime rate in 2018
| Southaven: | 64.8 |
| U.S. Average: | 221.2 |
Violent crime rate in 2017
| Southaven: | 90.9 |
| U.S. Average: | 226.2 |
Violent crime rate in 2016
| Southaven: | 62.8 |
| U.S. Average: | 227.3 |
Violent crime rate in 2015
| Southaven: | 123.8 |
| U.S. Average: | 219.3 |
Violent crime rate in 2014
| Southaven: | 152.5 |
| U.S. Average: | 211.1 |
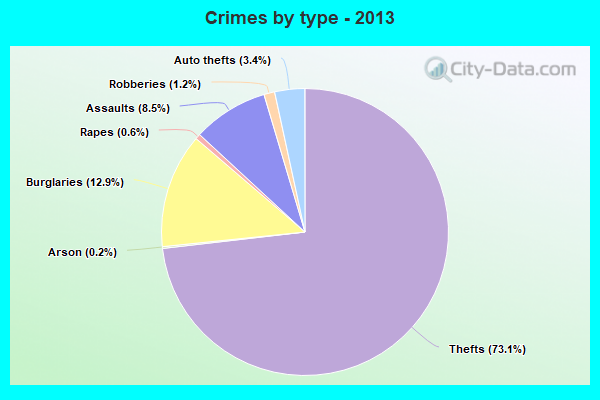
Violent crime rate in 2013
| Southaven: | 174.2 |
| U.S. Average: | 214.2 |
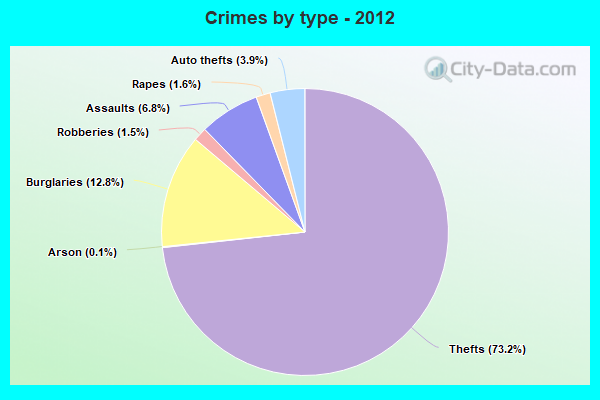
Violent crime rate in 2012
| Southaven: | 170.2 |
| U.S. Average: | 187.4 |
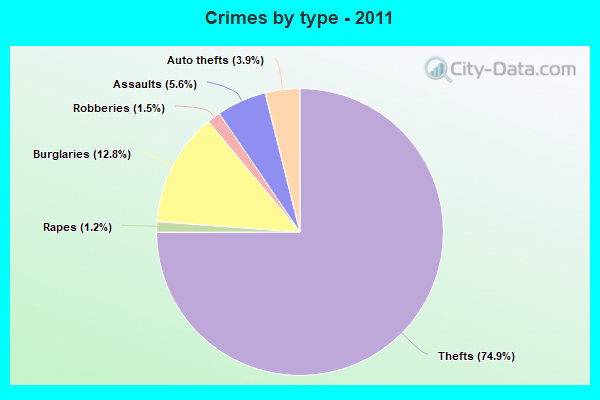
Violent crime rate in 2011
| Southaven: | 162.7 |
| U.S. Average: | 187.1 |
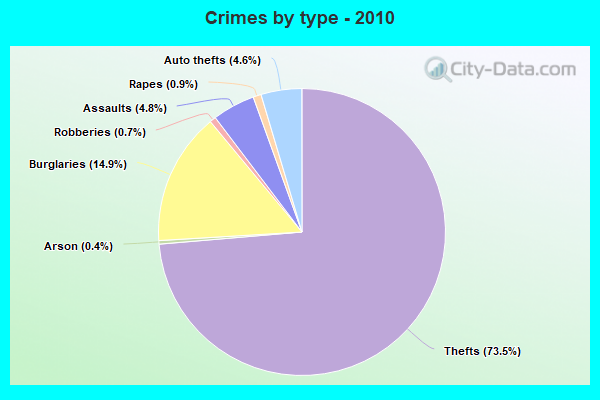
Violent crime rate in 2010
| Southaven: | 156.2 |
| U.S. Average: | 195.7 |
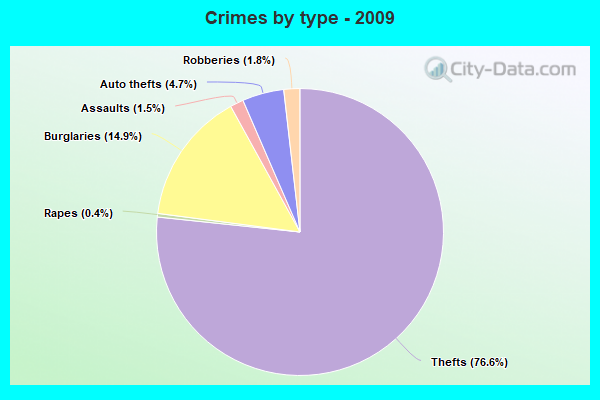
Violent crime rate in 2009
| Southaven: | 103.1 |
| U.S. Average: | 208.9 |
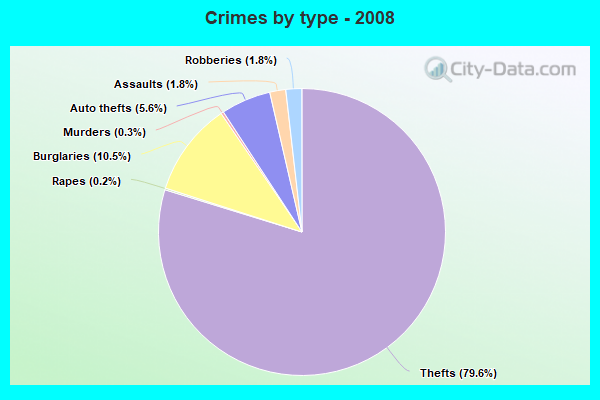
Violent crime rate in 2008
| Southaven: | 120.0 |
| U.S. Average: | 222.5 |
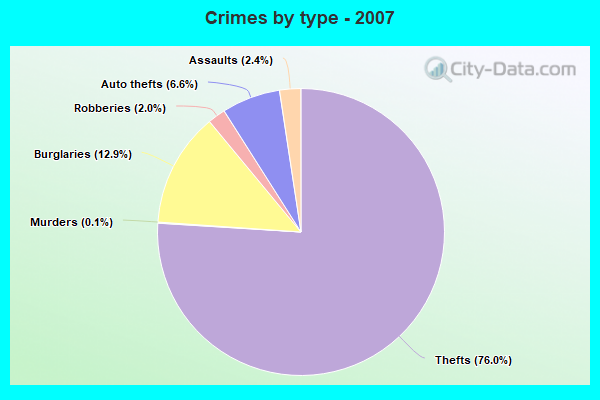
Violent crime rate in 2007
| Southaven: | 81.3 |
| U.S. Average: | 229.1 |
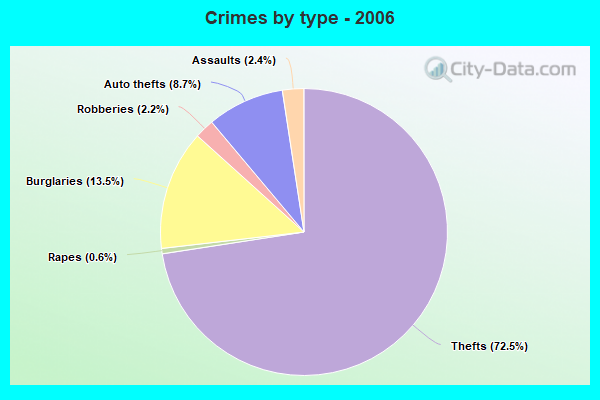
Violent crime rate in 2006
| Southaven: | 118.9 |
| U.S. Average: | 232.6 |
Violent crime rate in 2005
| Southaven: | 98.8 |
| U.S. Average: | 227.0 |
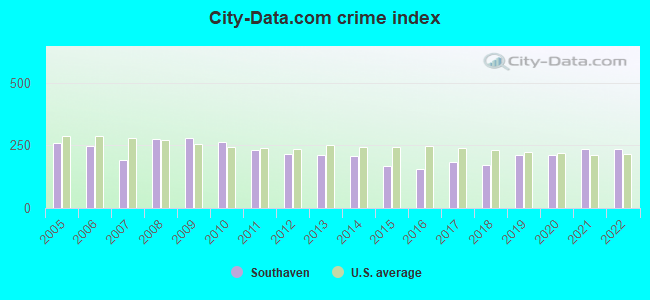
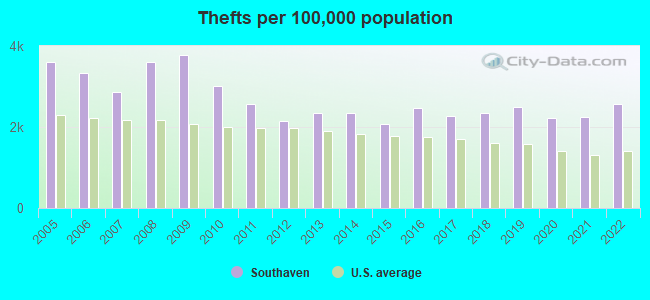
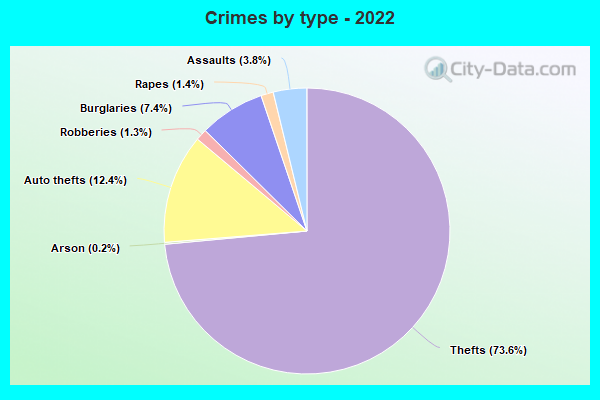
Property crime rate in 2022
| Southaven: | 245.4 |
| U.S. Average: | 166.5 |
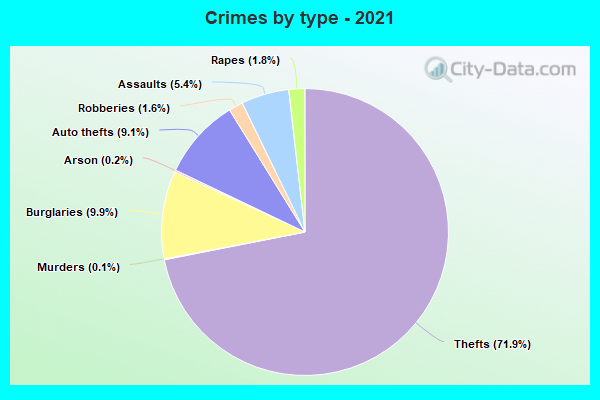
Property crime rate in 2021
| Southaven: | 215.7 |
| U.S. Average: | 157.8 |
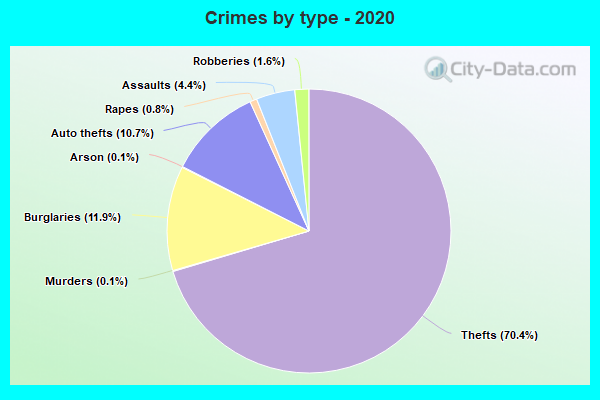
Property crime rate in 2020
| Southaven: | 235.9 |
| U.S. Average: | 169.6 |
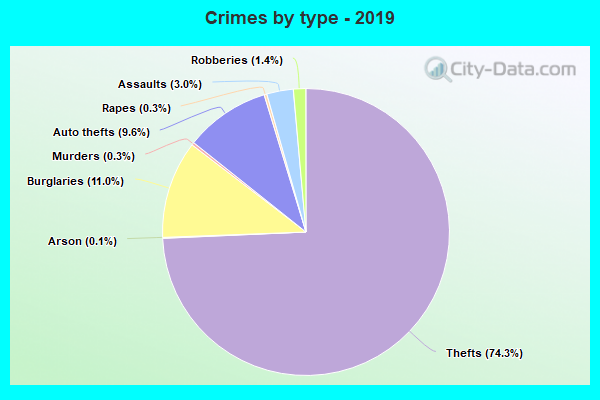
Property crime rate in 2019
| Southaven: | 247.4 |
| U.S. Average: | 179.7 |
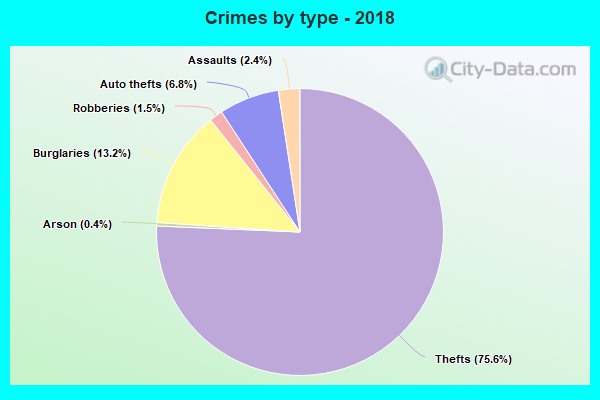
Property crime rate in 2018
| Southaven: | 232.1 |
| U.S. Average: | 190.2 |
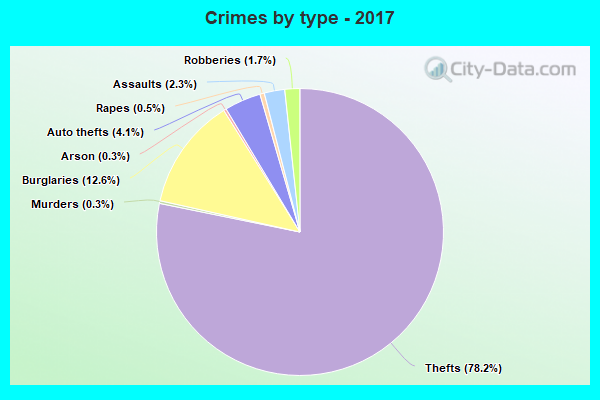
Property crime rate in 2017
| Southaven: | 203.5 |
| U.S. Average: | 206.4 |
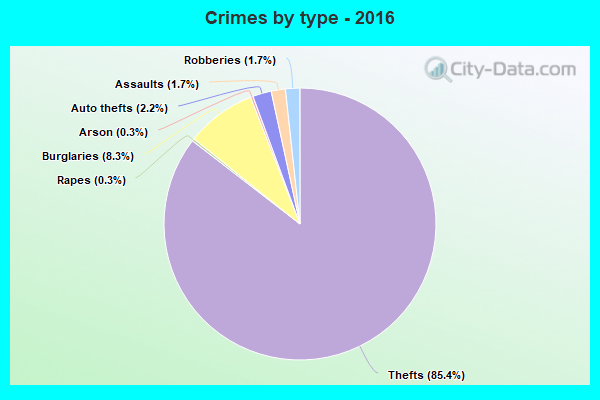
Property crime rate in 2016
| Southaven: | 181.2 |
| U.S. Average: | 216.6 |
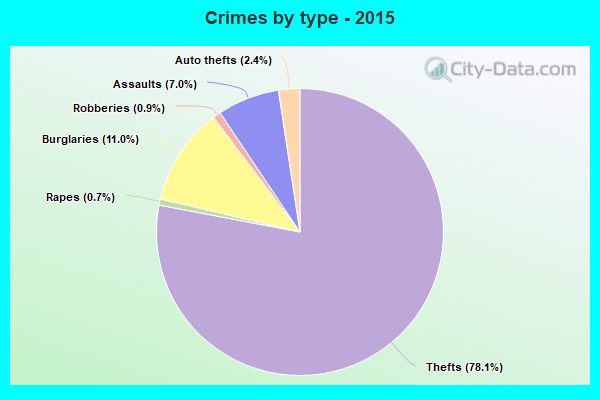
Property crime rate in 2015
| Southaven: | 172.2 |
| U.S. Average: | 221.5 |
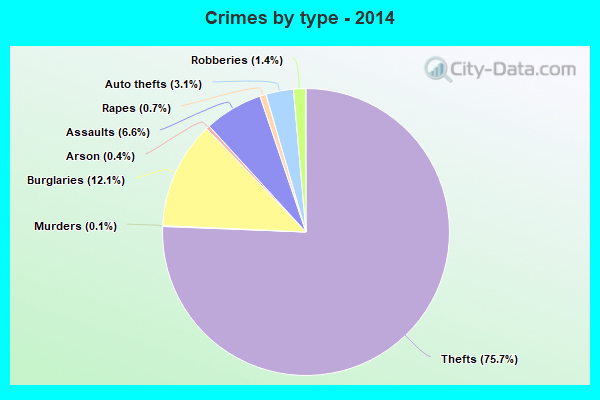
Property crime rate in 2014
| Southaven: | 207.5 |
| U.S. Average: | 230.8 |
Property crime rate in 2013
| Southaven: | 216.2 |
| U.S. Average: | 250.4 |
Property crime rate in 2012
| Southaven: | 201.0 |
| U.S. Average: | 267.3 |
Property crime rate in 2011
| Southaven: | 235.9 |
| U.S. Average: | 273.5 |
Property crime rate in 2010
| Southaven: | 302.6 |
| U.S. Average: | 276.4 |
Property crime rate in 2009
| Southaven: | 370.1 |
| U.S. Average: | 285.6 |
Property crime rate in 2008
| Southaven: | 312.7 |
| U.S. Average: | 302.2 |
Property crime rate in 2007
| Southaven: | 241.0 |
| U.S. Average: | 309.2 |
Property crime rate in 2006
| Southaven: | 303.9 |
| U.S. Average: | 317.3 |
Property crime rate in 2005
| Southaven: | 316.1 |
| U.S. Average: | 322.3 |
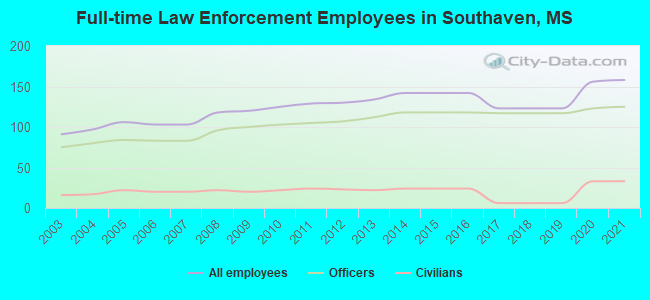
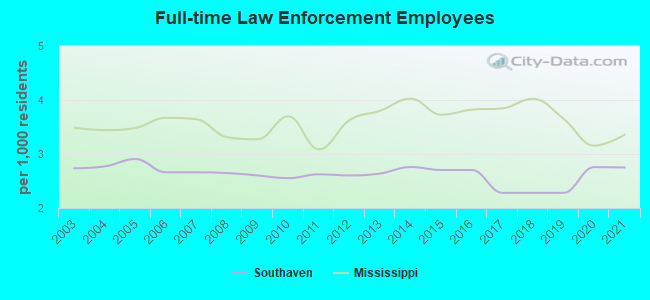
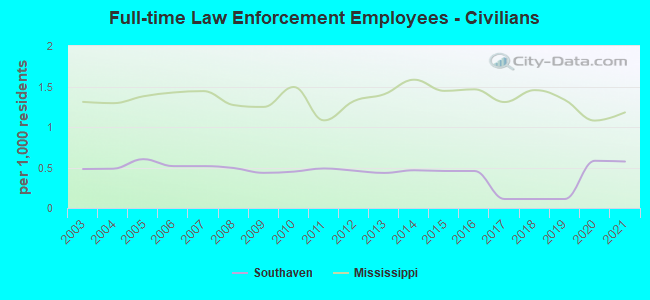
Full-time law enforcement employees in 2021, including police officers: 158 (125 officers - 111 male; 14 female).
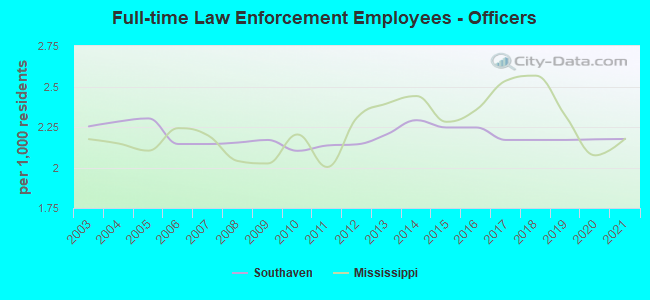
| Officers per 1,000 residents here: | 2.18 |
| Mississippi average: | 2.18 |
Full-time law enforcement employees in 2020, including police officers: 156 (123 officers - 111 male; 12 female).
| Officers per 1,000 residents here: | 2.17 |
| Mississippi average: | 2.08 |
Full-time law enforcement employees in 2017, including police officers: 123 (117 officers - 108 male; 9 female).
| Officers per 1,000 residents here: | 2.17 |
| Mississippi average: | 2.54 |
Full-time law enforcement employees in 2015, including police officers: 142 (118 officers - 108 male; 10 female).
| Officers per 1,000 residents here: | 2.25 |
| Mississippi average: | 2.28 |
Full-time law enforcement employees in 2014, including police officers: 142 (118 officers - 108 male; 10 female).
| Officers per 1,000 residents here: | 2.29 |
| Mississippi average: | 2.44 |
Full-time law enforcement employees in 2013, including police officers: 134 (112 officers - 105 male; 7 female).
| Officers per 1,000 residents here: | 2.20 |
| Mississippi average: | 2.40 |
Full-time law enforcement employees in 2012, including police officers: 130 (107 officers - 102 male; 5 female).
| Officers per 1,000 residents here: | 2.14 |
| Mississippi average: | 2.31 |
Full-time law enforcement employees in 2011, including police officers: 129 (105 officers - 99 male; 6 female).
| Officers per 1,000 residents here: | 2.14 |
| Mississippi average: | 2.00 |
Full-time law enforcement employees in 2010, including police officers: 125 (103 officers - 98 male; 5 female).
| Officers per 1,000 residents here: | 2.10 |
| Mississippi average: | 2.20 |
Full-time law enforcement employees in 2009, including police officers: 120 (100 officers - 92 male; 8 female).
| Officers per 1,000 residents here: | 2.17 |
| Mississippi average: | 2.02 |
Full-time law enforcement employees in 2008, including police officers: 118 (96 officers - 90 male; 6 female).
| Officers per 1,000 residents here: | 2.15 |
| Mississippi average: | 2.04 |
Full-time law enforcement employees in 2006, including police officers: 103 (83 officers - 77 male; 6 female).
| Officers per 1,000 residents here: | 2.14 |
| Mississippi average: | 2.24 |
Full-time law enforcement employees in 2005, including police officers: 106 (84 officers - 80 male; 4 female).
| Officers per 1,000 residents here: | 2.30 |
| Mississippi average: | 2.10 |
Full-time law enforcement employees in 2004, including police officers: 97 (80 officers - 74 male; 6 female).
| Officers per 1,000 residents here: | 2.28 |
| Mississippi average: | 2.15 |
Full-time law enforcement employees in 2003, including police officers: 91 (75 officers - 70 male; 5 female).
| Officers per 1,000 residents here: | 2.25 |
| Mississippi average: | 2.18 |
Zip codes: 38672.