Crime rate in Winston-Salem, North Carolina (NC): murders, rapes, robberies, assaults, burglaries, thefts, auto thefts, arson, law enforcement employees, police officers, crime map
Crime rate in Winston-Salem, NC
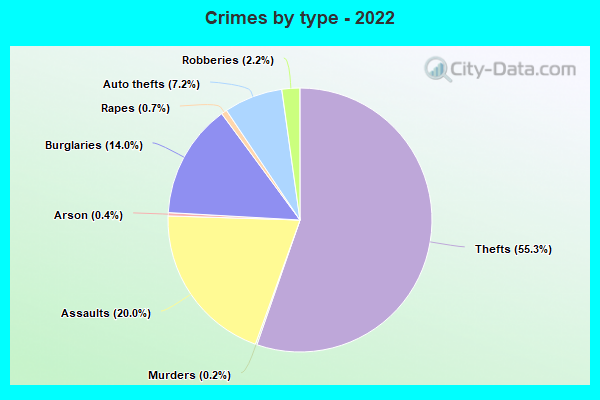
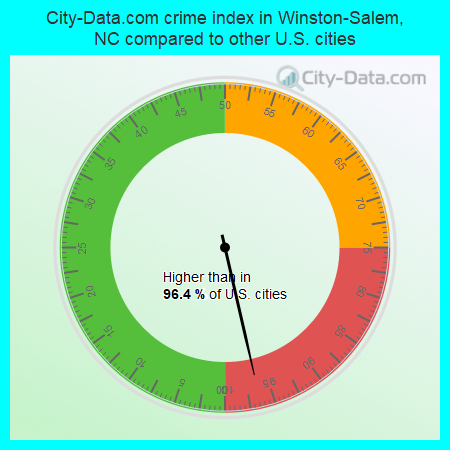
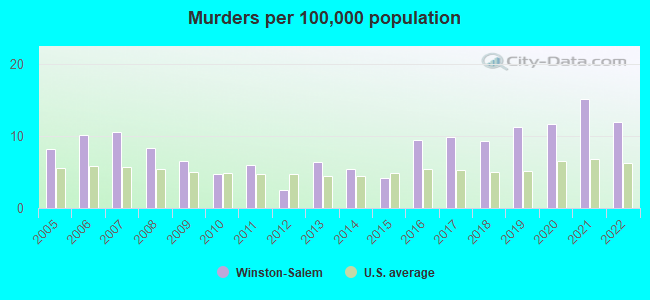
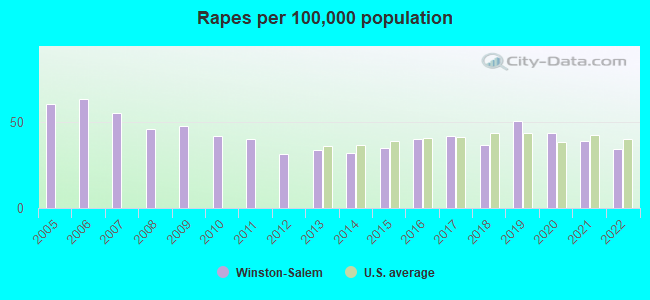
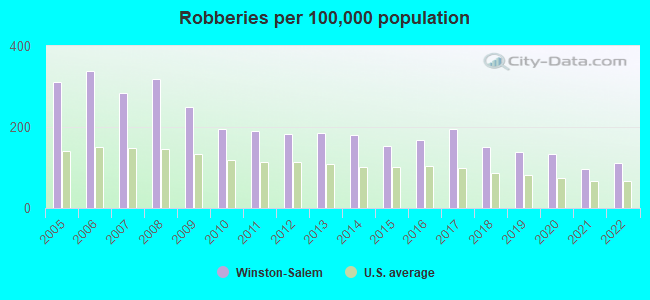
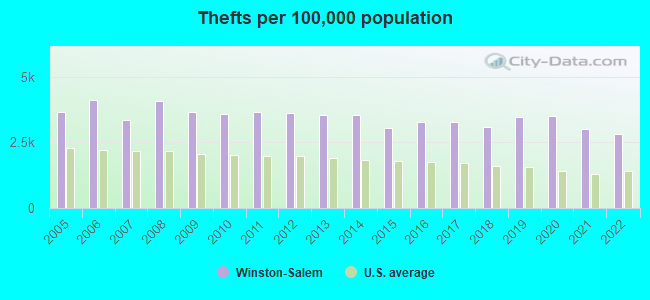
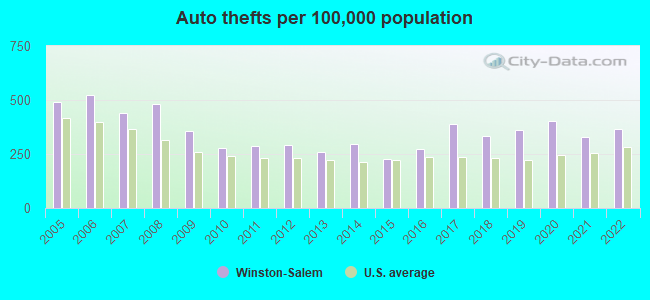
The 2022 crime rate in Winston-Salem, NC is 480 (City-Data.com crime index), which is 2.0 times greater than the U.S. average. It was higher than in 96.4% U.S. cities. The 2022 Winston-Salem crime rate fell by 1% compared to 2021. The number of homicides stood at 30 - a decrease of 8 compared to 2021. In the last 5 years Winston-Salem has seen rise of violent crime and decreasing property crime.See how dangerous Winston-Salem, NC is compared to the nearest cities:
(Note: Higher means more crime)
(Note: Higher means more crime)
| Winston-Salem: | 480.4 |
| Kernersville: | 236.3 |
| King: | 109.5 |
| High Point: | 287.6 |
| Thomasville: | 145.7 |
| Lexington: | 302.5 |
| Archdale: | 126.2 |
| Yadkinville: | 210.4 |
| Pilot Mountain: | 179.4 |
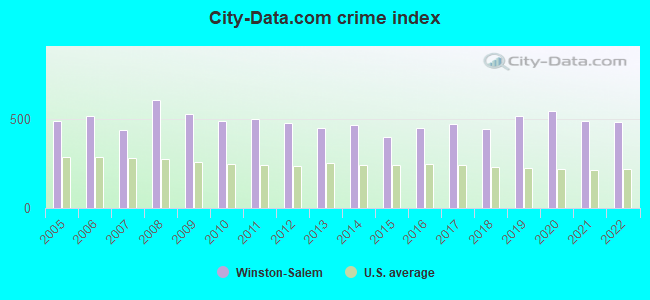
The City-Data.com crime index weighs serious crimes and violent crimes more heavily. Higher means more crime, U.S. average is 246.1. It adjusts for the number of visitors and daily workers commuting into cities.
- means the value is smaller than the state average.- means the value is about the same as the state average.
- means the value is bigger than the state average.
- means the value is much bigger than the state average.
According to our research of North Carolina and other state lists, there were 503 registered sex offenders living in Winston-Salem, North Carolina as of April 17, 2024.
The ratio of all residents to sex offenders in Winston-Salem is 482 to 1.
The ratio of registered sex offenders to all residents in this city is near the state average.
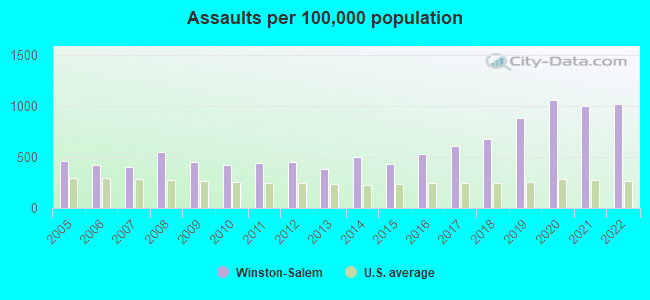
Violent crime rate in 2022
| Winston-Salem: | 623.0 |
| U.S. Average: | 219.8 |
Violent crime rate in 2021
| Winston-Salem: | 618.6 |
| U.S. Average: | 224.8 |
Violent crime rate in 2020
| Winston-Salem: | 662.9 |
| U.S. Average: | 228.2 |
Violent crime rate in 2019
| Winston-Salem: | 583.0 |
| U.S. Average: | 219.9 |
Violent crime rate in 2018
| Winston-Salem: | 469.3 |
| U.S. Average: | 221.2 |
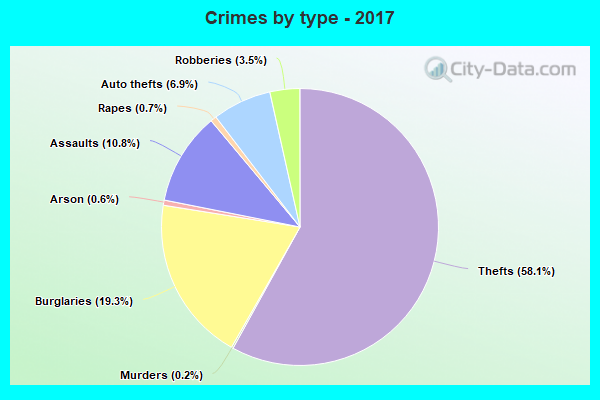
Violent crime rate in 2017
| Winston-Salem: | 463.0 |
| U.S. Average: | 226.2 |
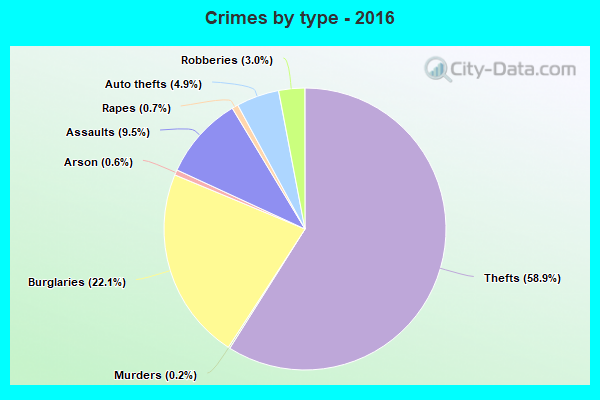
Violent crime rate in 2016
| Winston-Salem: | 408.6 |
| U.S. Average: | 227.3 |
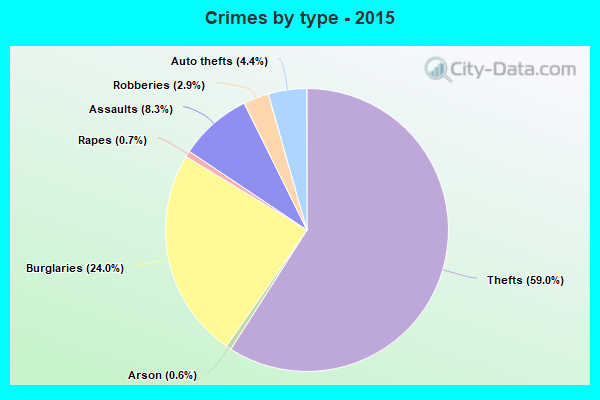
Violent crime rate in 2015
| Winston-Salem: | 335.6 |
| U.S. Average: | 219.3 |
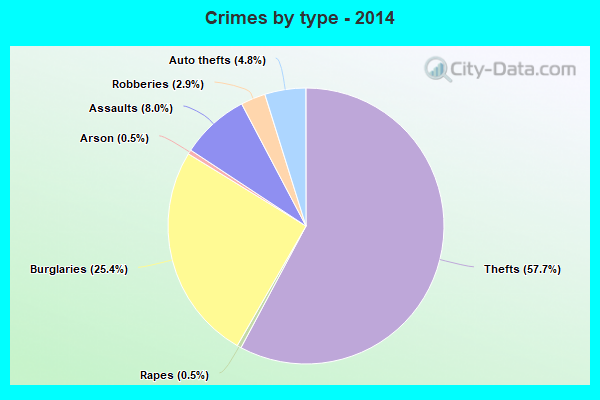
Violent crime rate in 2014
| Winston-Salem: | 380.5 |
| U.S. Average: | 211.1 |
Violent crime rate in 2013
| Winston-Salem: | 328.9 |
| U.S. Average: | 214.2 |
Violent crime rate in 2012
| Winston-Salem: | 351.1 |
| U.S. Average: | 187.4 |
Violent crime rate in 2011
| Winston-Salem: | 365.5 |
| U.S. Average: | 187.1 |
Violent crime rate in 2010
| Winston-Salem: | 358.4 |
| U.S. Average: | 195.7 |
Violent crime rate in 2009
| Winston-Salem: | 410.0 |
| U.S. Average: | 208.9 |
Violent crime rate in 2008
| Winston-Salem: | 494.6 |
| U.S. Average: | 222.5 |
Violent crime rate in 2007
| Winston-Salem: | 352.8 |
| U.S. Average: | 229.1 |
Violent crime rate in 2006
| Winston-Salem: | 388.7 |
| U.S. Average: | 232.6 |
Violent crime rate in 2005
| Winston-Salem: | 387.0 |
| U.S. Average: | 227.0 |
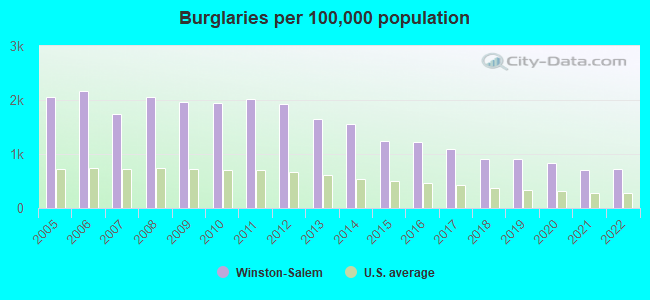
Property crime rate in 2022
| Winston-Salem: | 338.5 |
| U.S. Average: | 166.5 |
Property crime rate in 2021
| Winston-Salem: | 340.7 |
| U.S. Average: | 157.8 |
Property crime rate in 2020
| Winston-Salem: | 401.8 |
| U.S. Average: | 169.6 |
Property crime rate in 2019
| Winston-Salem: | 410.8 |
| U.S. Average: | 179.7 |
Property crime rate in 2018
| Winston-Salem: | 385.3 |
| U.S. Average: | 190.2 |
Property crime rate in 2017
| Winston-Salem: | 438.7 |
| U.S. Average: | 206.4 |
Property crime rate in 2016
| Winston-Salem: | 450.6 |
| U.S. Average: | 216.6 |
Property crime rate in 2015
| Winston-Salem: | 434.6 |
| U.S. Average: | 221.5 |
Property crime rate in 2014
| Winston-Salem: | 535.1 |
| U.S. Average: | 230.8 |
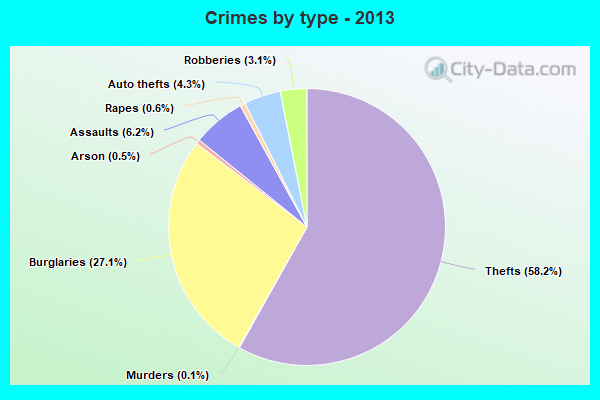
Property crime rate in 2013
| Winston-Salem: | 545.4 |
| U.S. Average: | 250.4 |
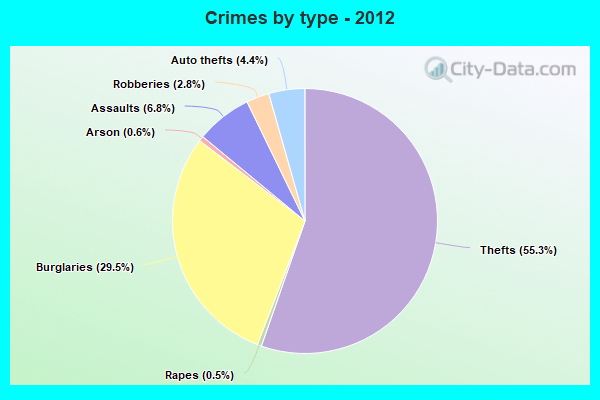
Property crime rate in 2012
| Winston-Salem: | 610.4 |
| U.S. Average: | 267.3 |
Property crime rate in 2011
| Winston-Salem: | 629.1 |
| U.S. Average: | 273.5 |
Property crime rate in 2010
| Winston-Salem: | 611.4 |
| U.S. Average: | 276.4 |
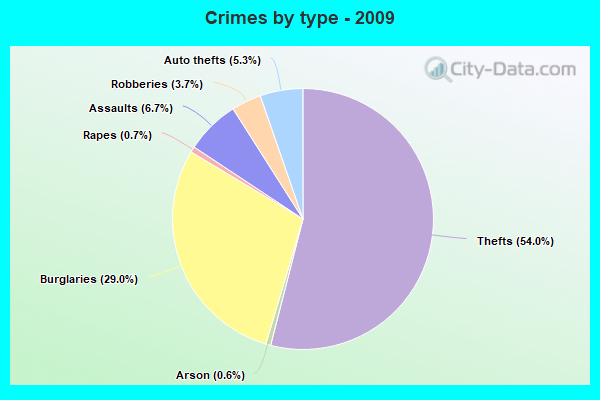
Property crime rate in 2009
| Winston-Salem: | 628.6 |
| U.S. Average: | 285.6 |
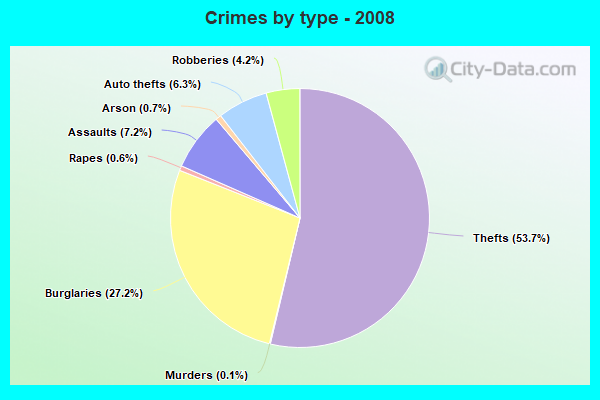
Property crime rate in 2008
| Winston-Salem: | 688.6 |
| U.S. Average: | 302.2 |
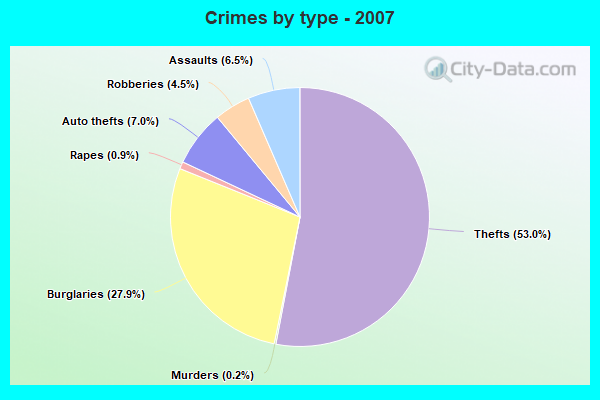
Property crime rate in 2007
| Winston-Salem: | 486.5 |
| U.S. Average: | 309.2 |
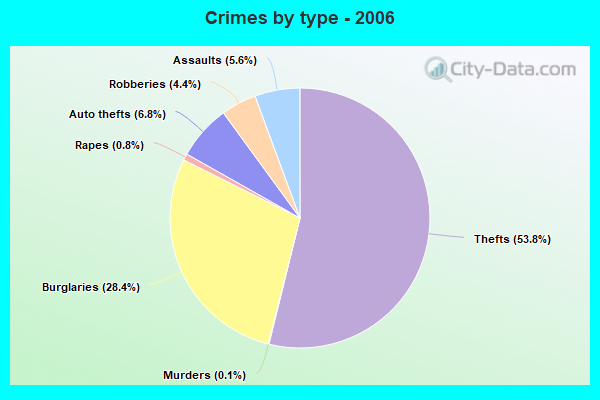
Property crime rate in 2006
| Winston-Salem: | 599.6 |
| U.S. Average: | 317.3 |
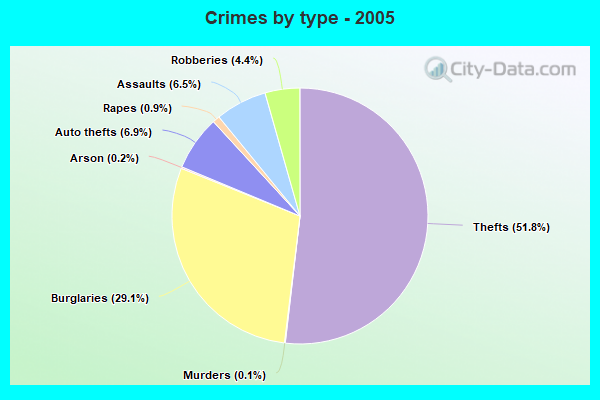
Property crime rate in 2005
| Winston-Salem: | 559.1 |
| U.S. Average: | 322.3 |
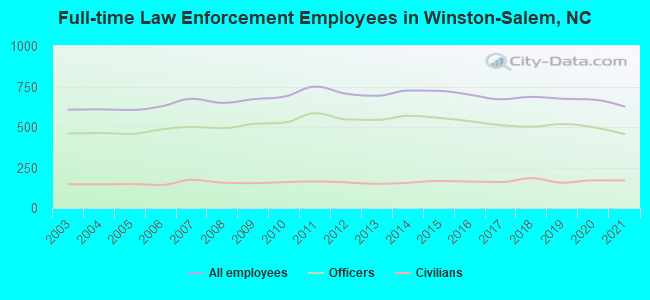
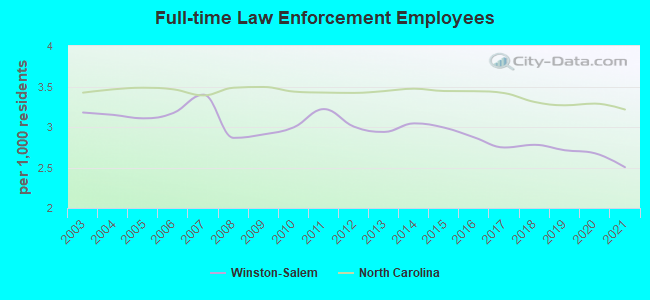
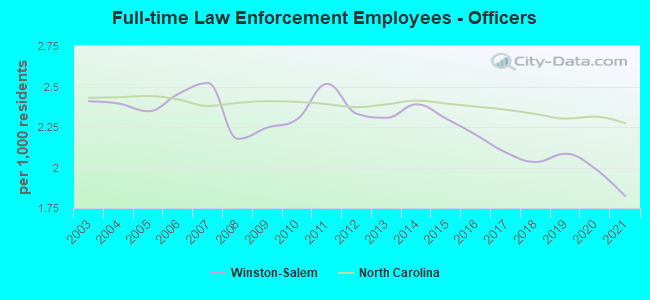
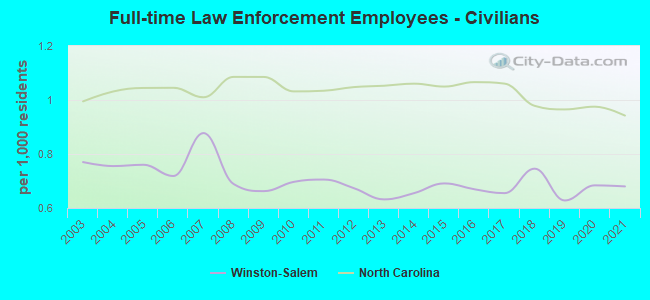
Full-time law enforcement employees in 2021, including police officers: 626 (456 officers - 386 male; 70 female).
| Officers per 1,000 residents here: | 1.82 |
| North Carolina average: | 2.27 |
Full-time law enforcement employees in 2020, including police officers: 669 (498 officers - 424 male; 74 female).
| Officers per 1,000 residents here: | 1.99 |
| North Carolina average: | 2.31 |
Full-time law enforcement employees in 2019, including police officers: 674 (518 officers - 440 male; 78 female).
| Officers per 1,000 residents here: | 2.08 |
| North Carolina average: | 2.30 |
Full-time law enforcement employees in 2018, including police officers: 686 (502 officers - 426 male; 76 female).
| Officers per 1,000 residents here: | 2.03 |
| North Carolina average: | 2.33 |
Full-time law enforcement employees in 2017, including police officers: 671 (511 officers - 432 male; 79 female).
| Officers per 1,000 residents here: | 2.09 |
| North Carolina average: | 2.36 |
Full-time law enforcement employees in 2016, including police officers: 699 (536 officers - 461 male; 75 female).
| Officers per 1,000 residents here: | 2.20 |
| North Carolina average: | 2.38 |
Full-time law enforcement employees in 2015, including police officers: 723 (556 officers - 472 male; 84 female).
| Officers per 1,000 residents here: | 2.30 |
| North Carolina average: | 2.39 |
Full-time law enforcement employees in 2014, including police officers: 725 (569 officers - 484 male; 85 female).
| Officers per 1,000 residents here: | 2.39 |
| North Carolina average: | 2.41 |
Full-time law enforcement employees in 2013, including police officers: 693 (544 officers - 465 male; 79 female).
| Officers per 1,000 residents here: | 2.31 |
| North Carolina average: | 2.39 |
Full-time law enforcement employees in 2012, including police officers: 705 (547 officers - 467 male; 80 female).
| Officers per 1,000 residents here: | 2.33 |
| North Carolina average: | 2.37 |
Full-time law enforcement employees in 2011, including police officers: 749 (585 officers - 500 male; 85 female).
| Officers per 1,000 residents here: | 2.52 |
| North Carolina average: | 2.39 |
Full-time law enforcement employees in 2010, including police officers: 688 (528 officers - 454 male; 74 female).
| Officers per 1,000 residents here: | 2.30 |
| North Carolina average: | 2.40 |
Full-time law enforcement employees in 2009, including police officers: 672 (519 officers - 461 male; 58 female).
| Officers per 1,000 residents here: | 2.25 |
| North Carolina average: | 2.41 |
Full-time law enforcement employees in 2008, including police officers: 649 (493 officers - 428 male; 65 female).
| Officers per 1,000 residents here: | 2.18 |
| North Carolina average: | 2.40 |
Full-time law enforcement employees in 2007, including police officers: 674 (500 officers - 435 male; 65 female).
| Officers per 1,000 residents here: | 2.52 |
| North Carolina average: | 2.38 |
Full-time law enforcement employees in 2006, including police officers: 627 (485 officers - 423 male; 62 female).
| Officers per 1,000 residents here: | 2.45 |
| North Carolina average: | 2.42 |
Full-time law enforcement employees in 2005, including police officers: 605 (457 officers - 401 male; 56 female).
| Officers per 1,000 residents here: | 2.35 |
| North Carolina average: | 2.44 |
Full-time law enforcement employees in 2004, including police officers: 609 (463 officers - 407 male; 56 female).
| Officers per 1,000 residents here: | 2.39 |
| North Carolina average: | 2.43 |
Full-time law enforcement employees in 2003, including police officers: 607 (460 officers - 405 male; 55 female).
| Officers per 1,000 residents here: | 2.41 |
| North Carolina average: | 2.43 |