Ada: Fire Incidents, Oklahoma (OK)
Where are fire incidents reported in Ada, OK
Something went wrong! Please refresh the page.
| Fire incidents reported | |
|---|---|
| Sreet name | Count |
| BROADWAY AVE | 126 |
| 14TH ST | 108 |
| MISSISSIPPI | 88 |
| MAIN | 82 |
| 9TH ST | 68 |
| 12TH ST | 66 |
| 18TH ST | 66 |
| 7TH ST | 62 |
| OAK | 62 |
| 10TH ST | 58 |
| 15TH ST | 58 |
| 16TH ST | 56 |
| ARLINGTON | 56 |
| COUNTRY CLUB DR | 56 |
| 17TH ST | 54 |
| 6TH ST | 50 |
| CHERRY | 50 |
| LONNIE ABBOTT INDUSTRIAL BLVD | 50 |
| 8TH ST | 46 |
| RICHARDSON LOOP | 44 |
| KERR LAB RD | 40 |
| 13TH ST | 38 |
| STOCKTON | 38 |
| MONTE VISTA | 36 |
| AHLOSO RD | 34 |
| CR 3600 | 34 |
| TOWNSEND | 34 |
| 1 | 30 |
| 3530 | 30 |
| 32ND ST | 28 |
| Other | 1,866 |
2002 - 2018 National Fire Incident Reporting System (NFIRS) incidents
- Incident types reported to NFIRS in Ada, OK
- 3,51434.9%Fire
- 2,49824.8%Rescue & EMS
- 1,68116.7%Hazardous Condition
- 1,19711.9%Good Intent Call
- 7487.4%False Alarm
- 4104.1%Service Call
- 130.1%Special Incident
- Fire incident types reported to NFIRS in Ada, OK
- 2,01757.4%Outside Fires
- 94827.0%Structure Fires
- 37110.6%Mobile Property/Vehicle Fires
- 1785.1%Other
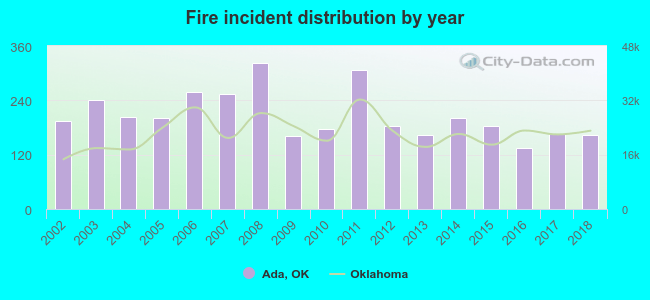 According to the data from the years 2002 - 2018 the average number of fires per year is 207. The highest number of reported fires - 323 took place in 2008, and the least - 135 in 2016. The data has a decreasing trend.
The average number of yearly fire incidents per 10k residents in Ada, OK compared to nearest cities:
(Note: Based on data for the last 3 years, including only cities with population 5,000 and above)
| Ada: | 90.5 |
| Sulphur: | 169.6 |
| Holdenville: | 92.3 |
| Pauls Valley: | 165.8 |
| Seminole: | 211.1 |
| Tecumseh: | 161.9 |
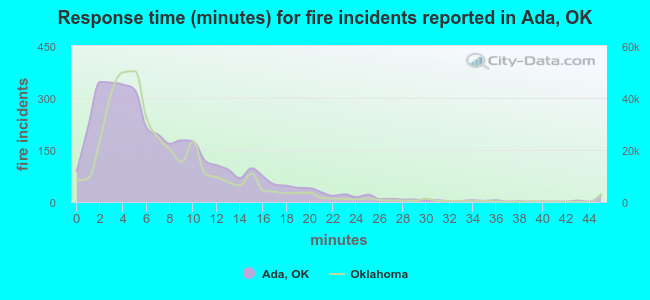 The median response time based on all reported fire incidents is 6 minutes. This is close to the state median value.
The median response time in Ada, OK compared to nearest cities:
(Note: Based on data for all years, including only cities with at least 500 fire incidents)
| Ada: | 6 minutes |
| Konawa: | 8 minutes |
| Sulphur: | 6 minutes |
| Holdenville: | 5 minutes |
| Wewoka: | 7 minutes |
| Pauls Valley: | 6 minutes |
| Davis: | 10 minutes |
| Seminole: | 7 minutes |
| Tishomingo: | 5 minutes |
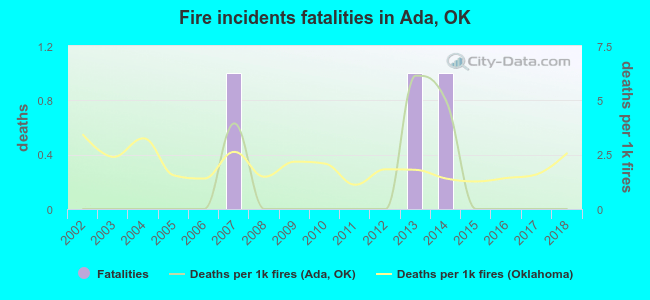 Based on the data from the years 2002 - 2018 the average number of fire-related yearly deaths is 0. The highest number of reported deaths - 1 took place in 2007, and the lowest - 0 in 2002. The data has a constant trend.
The average number of deaths per 1,000 fires is 1. This indicator was the highest - 6 in 2013, and the lowest 0 in 2002. The trend for deaths per 1,000 fires is constant. Compared to the state value the number of fatalities per 1,000 fires is much lower.
Based on the data from the years 2002 - 2018 the average number of fire-related yearly deaths is 0. The highest number of reported deaths - 1 took place in 2007, and the lowest - 0 in 2002. The data has a constant trend.
The average number of deaths per 1,000 fires is 1. This indicator was the highest - 6 in 2013, and the lowest 0 in 2002. The trend for deaths per 1,000 fires is constant. Compared to the state value the number of fatalities per 1,000 fires is much lower.Deaths per 1,000 incidents in Ada, OK compared to nearest cities:
(Note: Based on data for all years, including only cities with at least 2,500 fire incidents)
| Ada: | 0.9 |
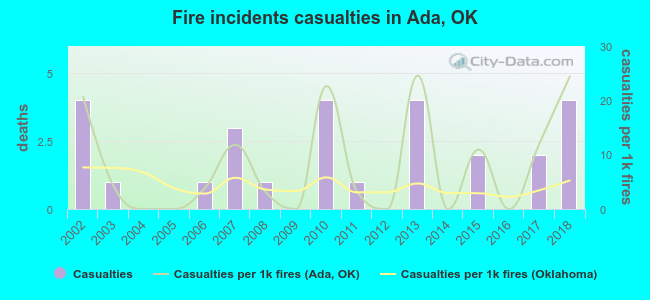 Based on the data from the years 2002 - 2018 the average number of fire-related yearly casualties is 2. The highest number of injuries - 4 took place in 2002, and the lowest - 0 in 2004. The data has a constant trend.
The average number of casualties per 1,000 fire incidents is 8. This indicator was the highest - 25 in 2013, and the lowest 0 in 2004. The trend for injuries per 1,000 incidents is increasing. Compared to the Oklahoma value the number of casualties per 1,000 fires is higher.
Based on the data from the years 2002 - 2018 the average number of fire-related yearly casualties is 2. The highest number of injuries - 4 took place in 2002, and the lowest - 0 in 2004. The data has a constant trend.
The average number of casualties per 1,000 fire incidents is 8. This indicator was the highest - 25 in 2013, and the lowest 0 in 2004. The trend for injuries per 1,000 incidents is increasing. Compared to the Oklahoma value the number of casualties per 1,000 fires is higher.Casualties per 1,000 incidents in Ada, OK compared to nearest cities:
(Note: Based on data for all years, including only cities with at least 500 fire incidents)
| Ada: | 7.7 |
| Konawa: | 0.0 |
| Sulphur: | 1.4 |
| Holdenville: | 1.0 |
| Wewoka: | 2.1 |
| Pauls Valley: | 0.7 |
| Davis: | 1.4 |
| Seminole: | 0.0 |
| Tishomingo: | 0.0 |
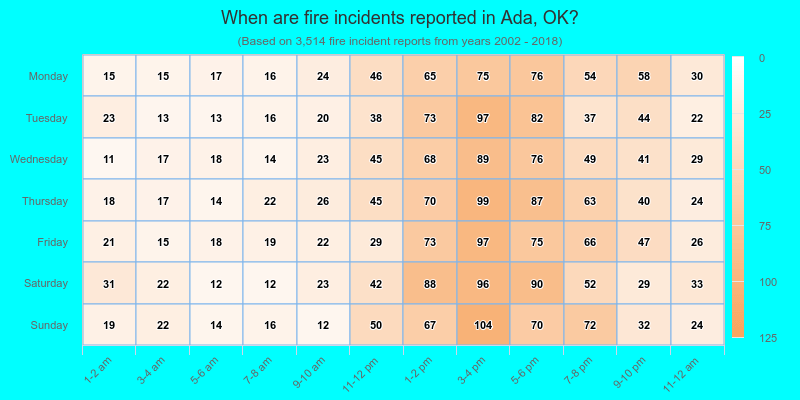
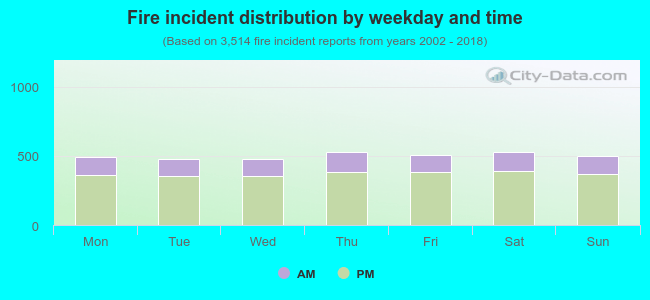 26.3% incidents where reported in the morning and 73.7% in the evening. The most fires (15.1%) took place on Saturday, and the least (13.6%) on Tuesday.
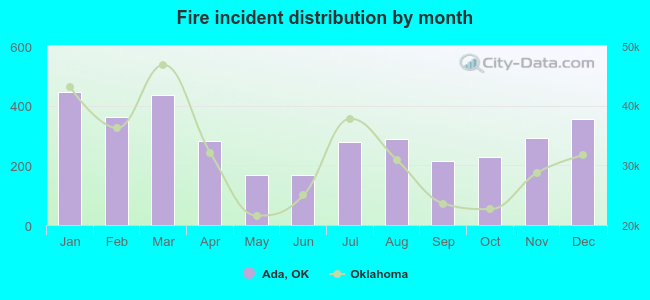 According to the 3,514 reports from years 2002 - 2018 most fires (12.7%) took place during January, and the least (4.7%) in May.
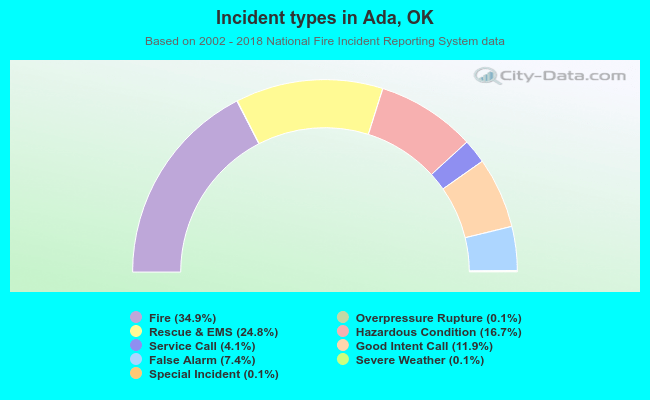 Out of all 10,075 cases reported during the years 2002 - 2018, the most belonged to the categories: Fire (34.9%), Rescue & EMS (24.8%), and Hazardous Condition (16.7%).
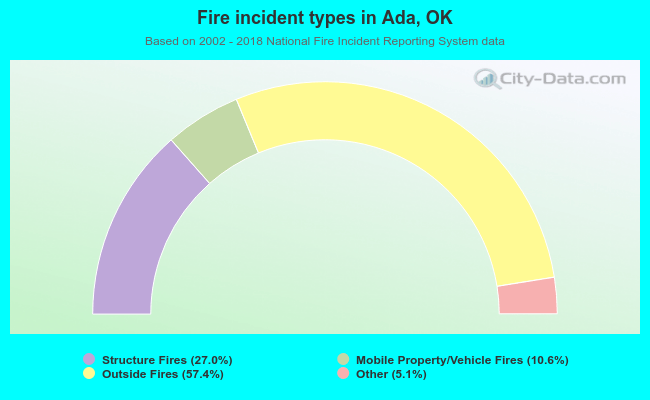 When looking into fire subcategories, the most incidents belonged to: Outside Fires (57.4%), and Structure Fires (27.0%).