| Fire incidents reported |
|---|
| Sreet name | Count |
|---|
| MAIN ST | 30 | | SECOND ST | 14 | | FRANKLIN ST | 12 | | 2ND ST | 10 | | BALDY HILL RD | 10 | | HUFFS CHURCH (88) RD | 10 | | HUFFS CHURCH RD | 10 | | MAINALB ST | 10 | | RIDGEVIEW DR | 10 | | TREICHLER88 RD | 10 | | PILGERT (86) ST | 8 | | PINEWIND DR | 8 | | SECONDALB ST | 8 | | TREICHLER RD | 8 | | CHERRY LN | 6 | | FAIRCHILD (86) ST | 6 | | HERITAGE DR | 6 | | LOCKRIDGE LN | 6 | | LONGSWAMP RD | 6 | | QUARRY RD | 6 | | SECOND (ALB) ST | 6 | | SPRING CREEK RD | 6 | | AVI DR | 4 | | BALDY HILL88 RD | 4 | | CHESTNUT (88) DR | 4 |
| | | Fire incidents reported |
|---|
| Sreet name | Count |
|---|
| CHESTNUT RD | 4 | | CHURCH (ALB) ST | 4 | | CONRAD (99) RD | 4 | | CONRAD RD | 4 | | CONRAD88 RD | 4 | | ELM RD | 4 | | FRONT (ALB) ST | 4 | | FRONT ST | 4 | | HEMPHILL (86) ST | 4 | | HENSINGERVILLE86 RD | 4 | | HUFFS CHURCH RD | 4 | | HUFFS CHURCH88 RD | 4 | | INDUSTRIAL PKY | 4 | | MAIN (ALB) ST | 4 | | MAINLM ST | 4 | | OAK (ALB) ST | 4 | | PENN AVE | 4 | | PILGERT86 ST | 4 | | QUARRY (LMAC) RD | 4 | | ROBERTS ST | 4 | | SCENIC VIEW DR | 4 | | STATE (86) ST | 4 | | THIRD ST | 4 | | TREICHLER (88) RD | 4 | | |
|
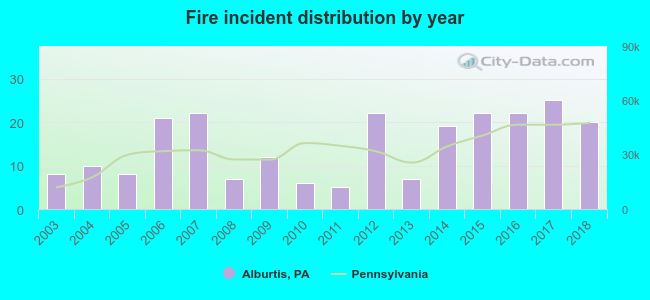 According to the data from the years 2003 - 2018 the average number of fires per year is 15. The highest number of reported fire incidents - 25 took place in 2017, and the least - 5 in 2011. The data has a growing trend.
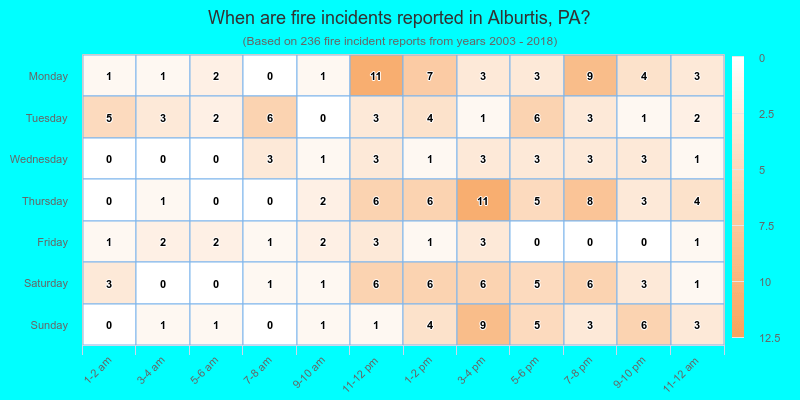
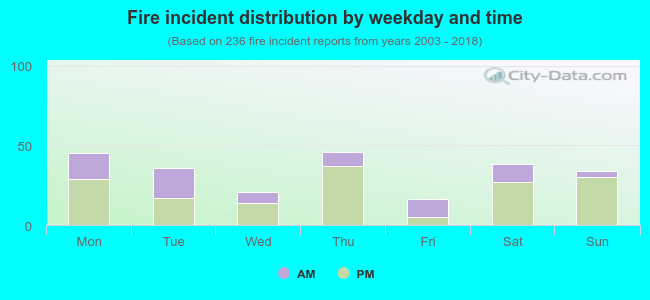 32.6% incidents where reported in the morning and 67.4% in the evening. The most fires (19.5%) took place on Thursday, and the least (6.8%) on Friday.
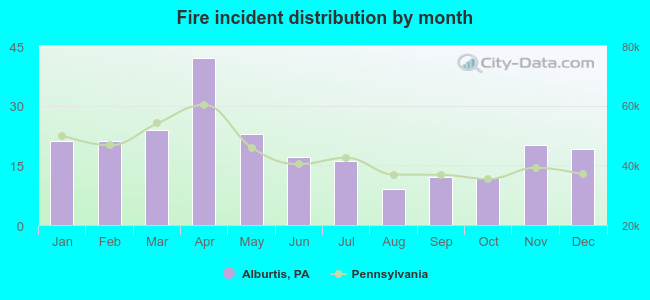 Based on the 236 incident reports from years 2003 - 2018 most fires (17.8%) took place during April, and the least (3.8%) in August.
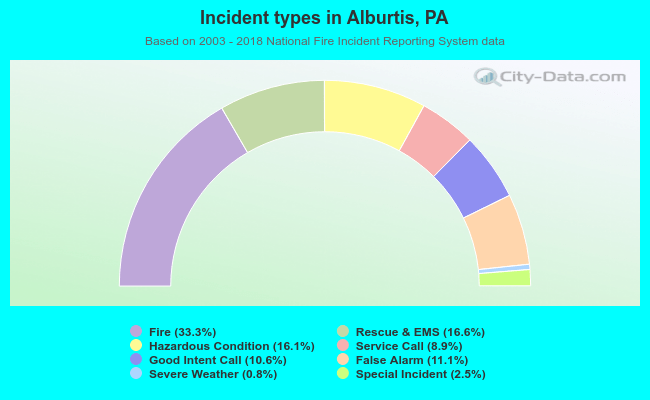 Out of all 709 cases reported during the years 2003 - 2018, the most belonged to the categories: Fire (33.3%), Overpressure Rupture (16.6%), and Rescue & EMS (16.1%).
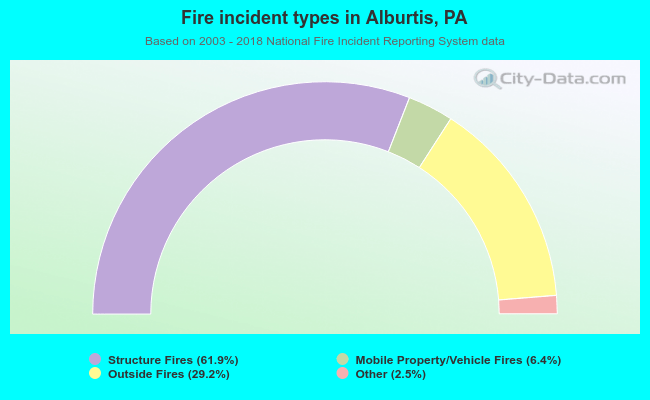 When looking into fire subcategories, the most incidents belonged to: Structure Fires (61.9%), and Outside Fires (29.2%).