Allendale: Fire Incidents, New Jersey (NJ)
Where are fire incidents reported in Allendale, NJ
Something went wrong! Please refresh the page.
|
| |||||||||||||||||||||||||||||||||||||||||||||||||||||||||||||||||||||||||||||||||||||||||||||||||||||||||||||
2002 - 2018 National Fire Incident Reporting System (NFIRS) incidents
- Incident types reported to NFIRS in Allendale, NJ
- 65437.2%Hazardous Condition
- 44625.4%False Alarm
- 37421.3%Fire
- 1418.0%Service Call
- 874.9%Good Intent Call
- 311.8%Rescue & EMS
- 100.6%Severe Weather
- 80.5%Overpressure Rupture
- 70.4%Special Incident
- Fire incident types reported to NFIRS in Allendale, NJ
- 26470.6%Structure Fires
- 5915.8%Outside Fires
- 287.5%Mobile Property/Vehicle Fires
- 236.1%Other
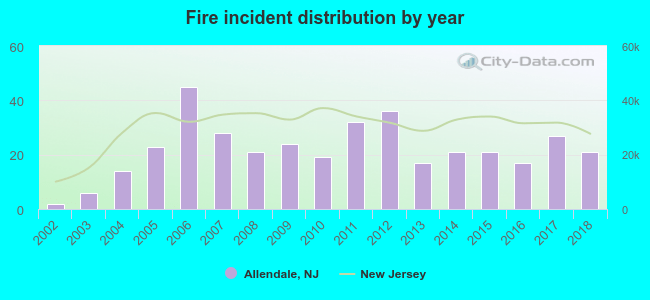 Based on the data from the years 2002 - 2018 the average number of fires per year is 22. The highest number of fires - 45 took place in 2006, and the least - 2 in 2002. The data has a rising trend.
The average number of yearly fire incidents per 10k residents in Allendale, NJ compared to nearest cities:
(Note: Based on data for the last 3 years, including only cities with population 5,000 and above)
| Allendale: | 31.9 |
| Waldwick: | 16.8 |
| Ramsey: | 53.6 |
| Upper Saddle River: | 16.0 |
| Midland Park: | 19.6 |
| Wyckoff: | 51.7 |
| Ridgewood: | 22.1 |
| Woodcliff Lake: | 6.2 |
| Franklin Lakes: | 20.3 |
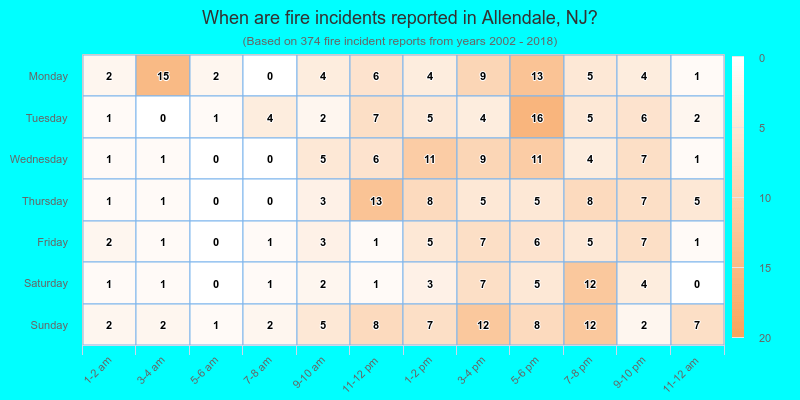
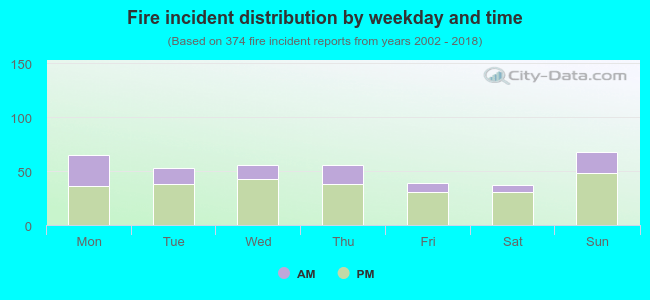 29.1% incidents where reported in the morning and 70.9% in the evening. The most fires (18.2%) took place on Sunday, and the least (9.9%) on Saturday.
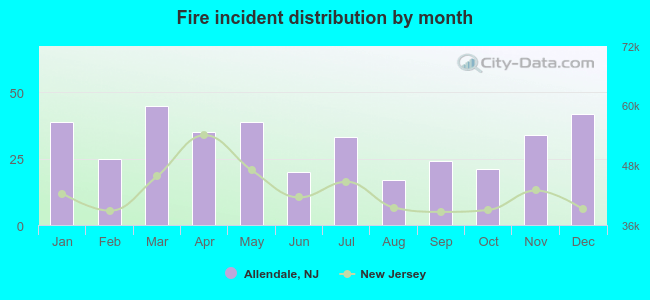 According to the 374 fires from years 2002 - 2018 most fires (12.0%) took place during March, and the least (4.5%) in August.
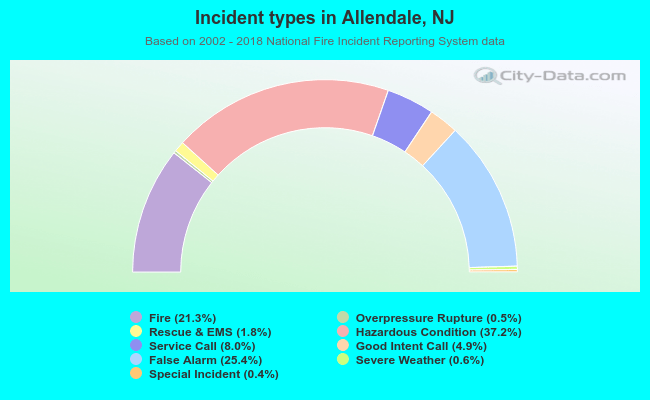 Out of all 1,758 cases reported during the years 2002 - 2018, the most belonged to the categories: Hazardous Condition (37.2%), False Alarm (25.4%), and Fire (21.3%).
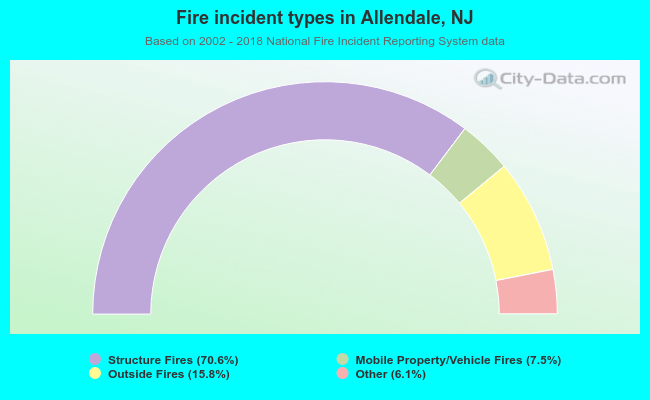 When looking into fire subcategories, the most reports belonged to: Structure Fires (70.6%), and Outside Fires (15.8%).