Amery: Fire Incidents, Wisconsin (WI)
Where are fire incidents reported in Amery, WI
Something went wrong! Please refresh the page.
|
| |||||||||||||||||||||||||||||||||||||||||||||||||||||||||||||||||||||||||||||||||||||||||||||||||||||||||||||
| Other | 63 | |||||||||||||||||||||||||||||||||||||||||||||||||||||||||||||||||||||||||||||||||||||||||||||||||||||||||||||
2004 - 2018 National Fire Incident Reporting System (NFIRS) incidents
- Incident types reported to NFIRS in Amery, WI
- 43642.3%Rescue & EMS
- 33532.5%Fire
- 11611.3%Hazardous Condition
- 939.0%Good Intent Call
- 373.6%False Alarm
- 111.1%Service Call
- 20.2%Special Incident
- Fire incident types reported to NFIRS in Amery, WI
- 14443.0%Structure Fires
- 12637.6%Outside Fires
- 4714.0%Mobile Property/Vehicle Fires
- 185.4%Other
 Based on the data from the years 2004 - 2018 the average number of fire incidents per year is 22. The highest number of reported fire incidents - 41 took place in 2007, and the least - 4 in 2014. The data has a growing trend.
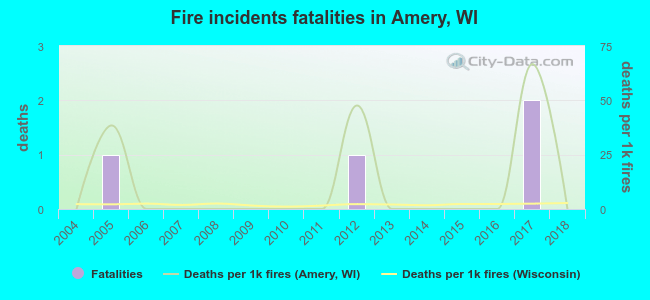 According to the data from the years 2004 - 2018 the average number of fire-related yearly deaths is 0. The highest number of reported deaths - 2 took place in 2017, and the lowest - 0 in 2004. The data has a constant trend.
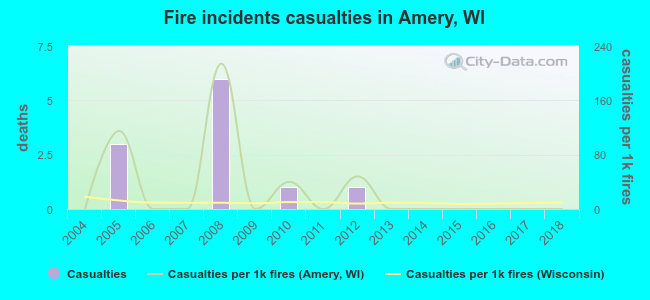 According to the reports from the years 2004 - 2018 the average number of fire-related casualties per year is 1. The highest number of casualties - 6 took place in 2008, and the lowest - 0 in 2004. The data has a constant trend.
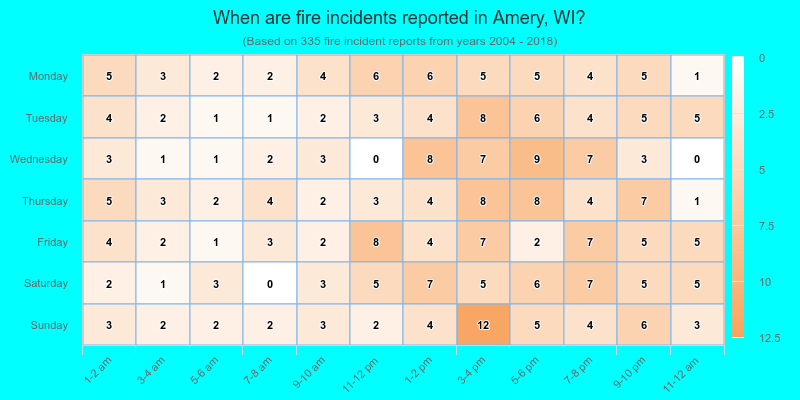
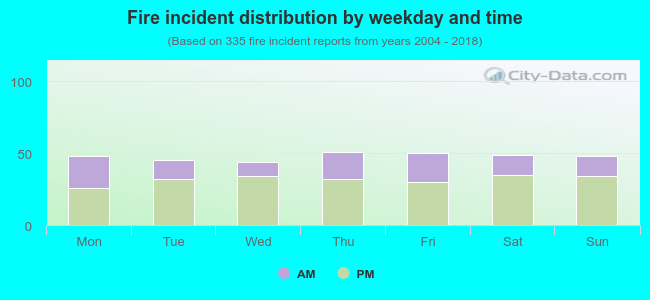 33.4% incidents where reported in the morning and 66.6% in the evening. The most fires (15.2%) took place on Thursday, and the least (13.1%) on Wednesday.
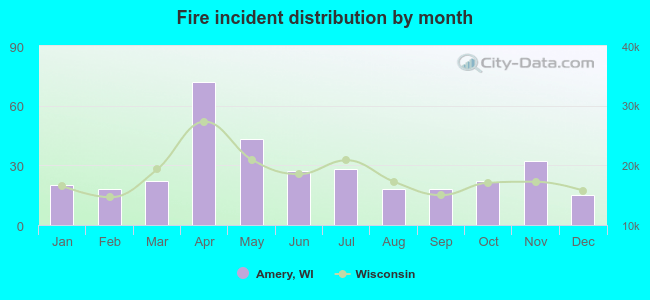 According to the 335 fires from years 2004 - 2018 most fires (21.5%) took place during April, and the least (4.5%) in December.
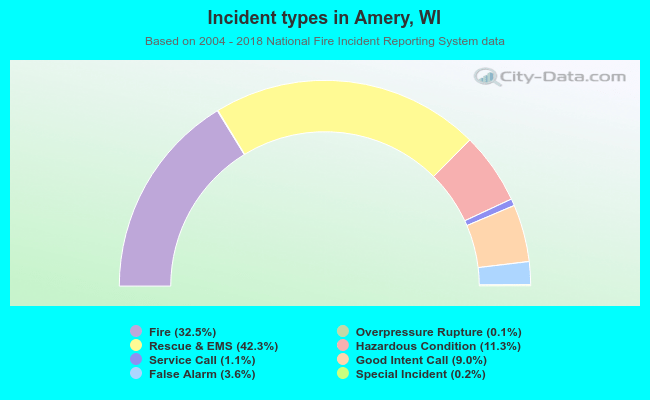 Out of all 1,031 cases reported during the years 2004 - 2018, the most belonged to the categories: Rescue & EMS (42.3%), Fire (32.5%), and Hazardous Condition (11.3%).
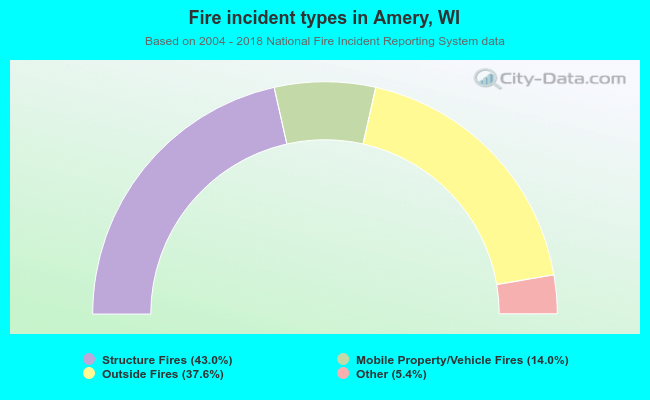 When looking into fire subcategories, the most incidents belonged to: Structure Fires (43.0%), and Outside Fires (37.6%).