Arlington: Fire Incidents, Virginia (VA)
Where are fire incidents reported in Arlington, VA
Something went wrong! Please refresh the page.
| Fire incidents reported | |
|---|---|
| Sreet name | Count |
| GLEBE RD | 416 |
| COLUMBIA PK | 292 |
| EADS ST | 204 |
| WILSON BL | 204 |
| CRYSTAL DR | 138 |
| JEFFERSON DAVIS HWY | 132 |
| FAIRFAX DR | 130 |
| HAYES ST | 130 |
| JOYCE ST | 126 |
| CARLIN SPRINGS RD | 124 |
| FOUR MILE RUN DR | 122 |
| PERSHING DR | 122 |
| 23RD ST | 120 |
| LEE HW | 116 |
| GEORGE MASON DR | 112 |
| COLUMBIA PIKE | 108 |
| GREENBRIER ST | 102 |
| QUINCY ST | 98 |
| SCOTT ST | 94 |
| ARMY NAVY DR | 92 |
| RANDOLPH ST | 90 |
| TAYLOR ST | 88 |
| JEFFERSON DAVIS HW | 86 |
| ROTARY RD | 86 |
| FERN ST | 76 |
| 9TH ST | 74 |
| CLARENDON BL | 74 |
| FREDERICK ST | 74 |
| 15TH ST | 72 |
| ARLINGTON BL | 72 |
| Other | 1,892 |
2002 - 2018 National Fire Incident Reporting System (NFIRS) incidents
- Incident types reported to NFIRS in Arlington, VA
- 48,79353.5%Rescue & EMS
- 11,21412.3%Good Intent Call
- 9,88110.8%Hazardous Condition
- 9,0379.9%False Alarm
- 6,1506.7%Service Call
- 5,6666.2%Fire
- 3340.4%Special Incident
- 1160.1%Overpressure Rupture
- Fire incident types reported to NFIRS in Arlington, VA
- 3,50161.8%Structure Fires
- 1,42625.2%Outside Fires
- 5279.3%Mobile Property/Vehicle Fires
- 2123.7%Other
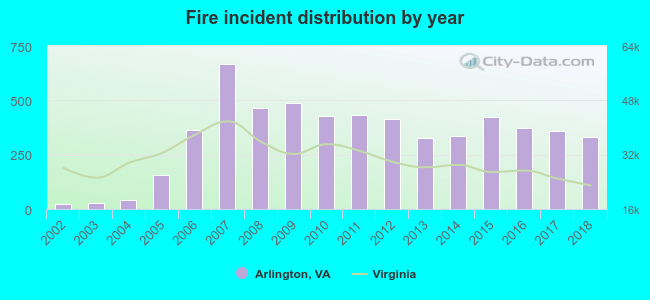 According to the data from the years 2002 - 2018 the average number of fires per year is 333. The highest number of reported fire incidents - 668 took place in 2007, and the least - 25 in 2002. The data has an increasing trend.
The average number of yearly fire incidents per 10k residents in Arlington, VA compared to nearest cities:
(Note: Based on data for the last 3 years, including only cities with population 5,000 and above)
| Arlington: | 17.1 |
| Seven Corners: | 15.1 |
| Falls Church: | 173.3 |
| Jefferson: | 1.1 |
| Alexandria: | 46.2 |
| McLean: | 19.5 |
| Idylwood: | 6.9 |
| Rose Hill: | 4.1 |
| Annandale: | 25.5 |
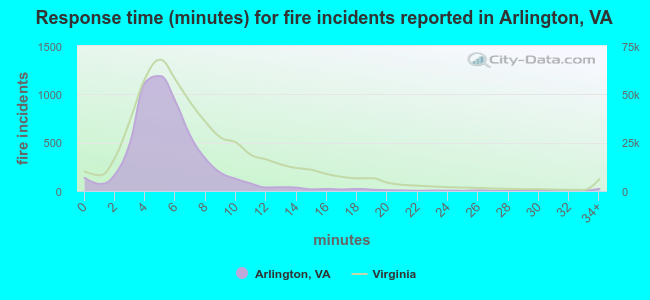 The median response time based on all reported fire incidents is 5 minutes. This is lower compared to the Virginia median value.
The median response time in Arlington, VA compared to nearest cities:
(Note: Based on data for all years, including only cities with at least 500 fire incidents)
| Arlington: | 5 minutes |
| Falls Church: | 5 minutes |
| Alexandria: | 5 minutes |
| McLean: | 6 minutes |
| Washington: | 4 minutes |
| Annandale: | 5 minutes |
| Bethesda: | 5 minutes |
| Springfield: | 6 minutes |
| Oxon Hill: | 7 minutes |
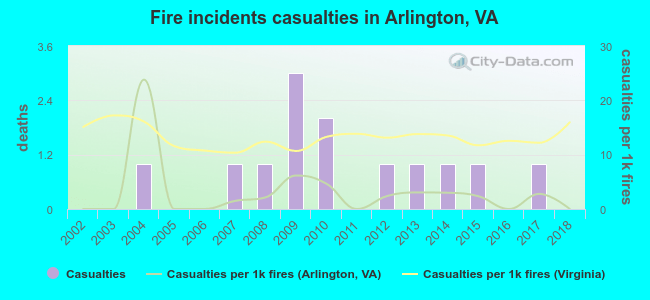 Based on the data from the years 2002 - 2018 the average number of fire-related yearly casualties is 1. The highest number of reported casualties - 3 took place in 2009, and the lowest - 0 in 2002. The data has a constant trend.
The average number of casualties per 1,000 fires is 3. This indicator was the highest - 24 in 2004, and the lowest 0 in 2002. The trend for injuries per 1,000 incidents is dropping. Compared to the Virginia value the number of injuries per 1,000 fires is much lower.
Based on the data from the years 2002 - 2018 the average number of fire-related yearly casualties is 1. The highest number of reported casualties - 3 took place in 2009, and the lowest - 0 in 2002. The data has a constant trend.
The average number of casualties per 1,000 fires is 3. This indicator was the highest - 24 in 2004, and the lowest 0 in 2002. The trend for injuries per 1,000 incidents is dropping. Compared to the Virginia value the number of injuries per 1,000 fires is much lower.Casualties per 1,000 incidents in Arlington, VA compared to nearest cities:
(Note: Based on data for all years, including only cities with at least 500 fire incidents)
| Arlington: | 2.3 |
| Falls Church: | 0.4 |
| Alexandria: | 6.6 |
| McLean: | 1.0 |
| Washington: | 1.1 |
| Annandale: | 6.0 |
| Bethesda: | 15.4 |
| Springfield: | 2.0 |
| Oxon Hill: | 9.1 |
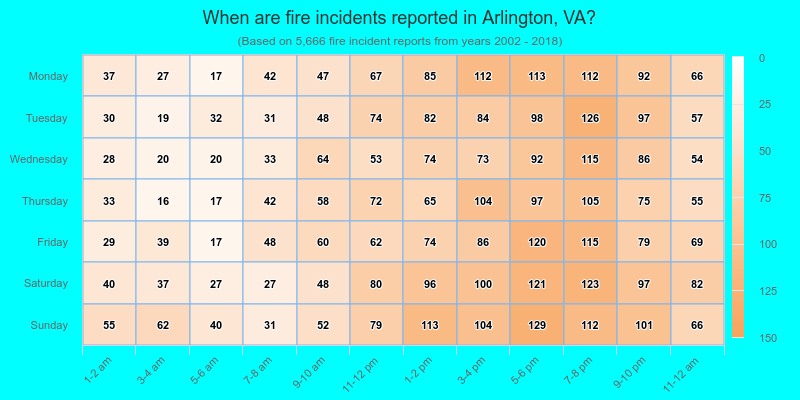
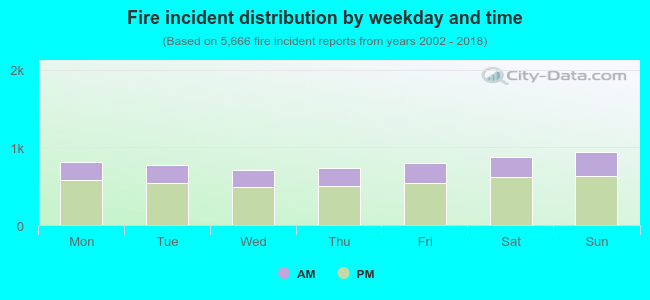 31.1% incidents where reported in the morning and 68.9% in the evening. The most fires (16.7%) took place on Sunday, and the least (12.6%) on Wednesday.
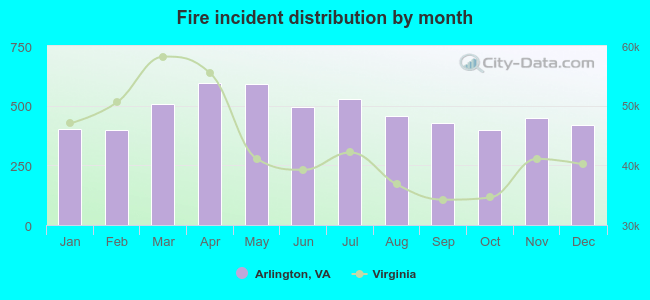 According to the 5,666 incident reports from years 2002 - 2018 most fires (10.5%) took place during April, and the least (7.0%) in February.
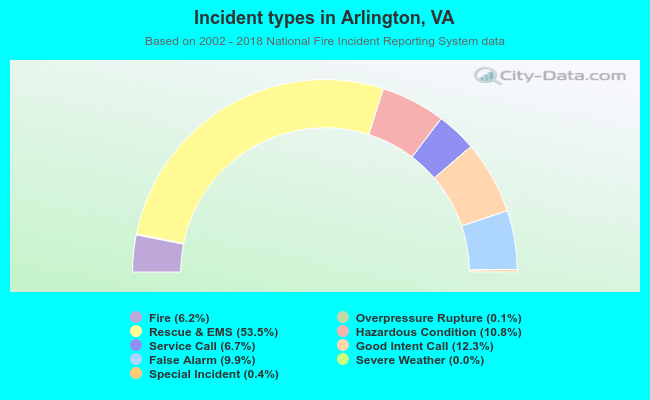 Out of all 91,218 cases reported during the years 2002 - 2018, the most belonged to the categories: Rescue & EMS (53.5%), Good Intent Call (12.3%), and Hazardous Condition (10.8%).
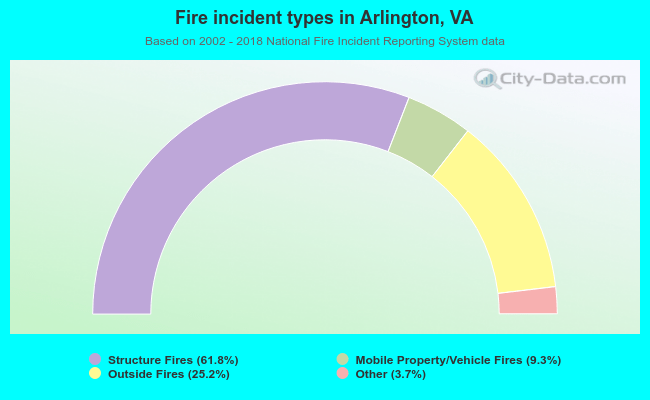 When looking into fire subcategories, the most reports belonged to: Structure Fires (61.8%), and Outside Fires (25.2%).