Arvada: Fire Incidents, Colorado (CO)
Where are fire incidents reported in Arvada, CO
Something went wrong! Please refresh the page.
| Fire incidents reported | |
|---|---|
| Sreet name | Count |
| WADSWORTH BLVD | 236 |
| SHERIDAN BLVD | 182 |
| PIERCE ST | 134 |
| RALSTON RD | 112 |
| 64 AVE | 102 |
| CARR ST | 94 |
| SIMMS ST | 82 |
| 84TH WAY | 80 |
| 64TH AVE | 76 |
| 52ND AVE | 74 |
| INDIANA ST | 72 |
| 58TH AVE | 62 |
| 52 AVE | 60 |
| 80 AVE | 60 |
| ALLISON ST | 60 |
| OBERON RD | 60 |
| 58 AVE | 58 |
| 72 AVE | 54 |
| GRANDVIEW AVE | 54 |
| HARLAN ST | 54 |
| BALSAM ST | 50 |
| LAMAR ST | 50 |
| MARSHALL ST | 50 |
| WARD RD | 50 |
| 59 AVE | 48 |
| OAK ST | 48 |
| KIPLING ST | 46 |
| 72ND AVE | 44 |
| POMONA DR | 42 |
| 53 AVE | 40 |
| Other | 1,079 |
2002 - 2018 National Fire Incident Reporting System (NFIRS) incidents
- Incident types reported to NFIRS in Arvada, CO
- 45,43162.6%Rescue & EMS
- 7,93110.9%Service Call
- 6,1528.5%Hazardous Condition
- 5,2767.3%False Alarm
- 4,3216.0%Good Intent Call
- 3,3134.6%Fire
- 950.1%Special Incident
- 740.1%Overpressure Rupture
- Fire incident types reported to NFIRS in Arvada, CO
- 1,44243.5%Outside Fires
- 1,03531.2%Structure Fires
- 48514.6%Mobile Property/Vehicle Fires
- 35110.6%Other
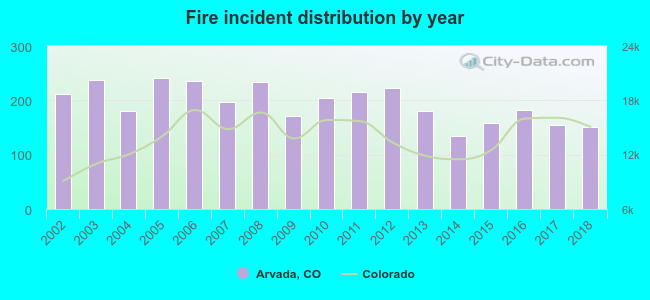 Based on the data from the years 2002 - 2018 the average number of fires per year is 195. The highest number of fire incidents - 241 took place in 2005, and the least - 134 in 2014. The data has a decreasing trend.
The average number of yearly fire incidents per 10k residents in Arvada, CO compared to nearest cities:
(Note: Based on data for the last 3 years, including only cities with population 5,000 and above)
| Arvada: | 14.3 |
| Wheat Ridge: | 29.3 |
| Westminster: | 19.6 |
| Federal Heights: | 36.4 |
| Golden: | 100.7 |
| Lakewood: | 24.8 |
| Welby: | 0.7 |
| Broomfield: | 16.5 |
| Superior: | 9.3 |
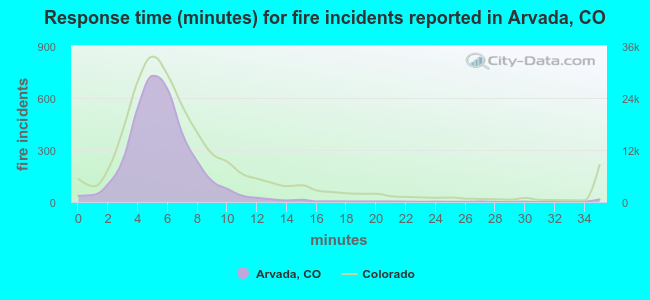 The median response time based on all reported fire incidents is 5 minutes. This is lower compared to the state median value.
The median response time in Arvada, CO compared to nearest cities:
(Note: Based on data for all years, including only cities with at least 500 fire incidents)
| Arvada: | 5 minutes |
| Wheat Ridge: | 5 minutes |
| Westminster: | 5 minutes |
| Federal Heights: | 5 minutes |
| Golden: | 7 minutes |
| Lakewood: | 5 minutes |
| Broomfield: | 6 minutes |
| Northglenn: | 6 minutes |
| Denver: | 4 minutes |
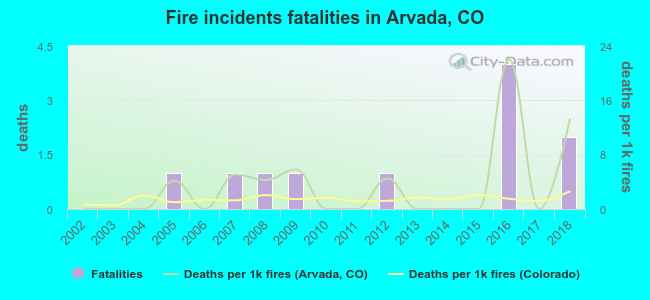 According to the data from the years 2002 - 2018 the average number of fire-related fatalities per year is 1. The highest number of reported deaths - 4 took place in 2016, and the lowest - 0 in 2002. The data has a rising trend.
The average number of fatalities per 1,000 fire incidents is 3. This indicator was the highest - 22 in 2016, and the lowest 0 in 2002. The trend for fatalities per 1,000 incidents is increasing. Compared to the Colorado value the number of deaths per 1,000 fire incidents is much higher.
According to the data from the years 2002 - 2018 the average number of fire-related fatalities per year is 1. The highest number of reported deaths - 4 took place in 2016, and the lowest - 0 in 2002. The data has a rising trend.
The average number of fatalities per 1,000 fire incidents is 3. This indicator was the highest - 22 in 2016, and the lowest 0 in 2002. The trend for fatalities per 1,000 incidents is increasing. Compared to the Colorado value the number of deaths per 1,000 fire incidents is much higher.
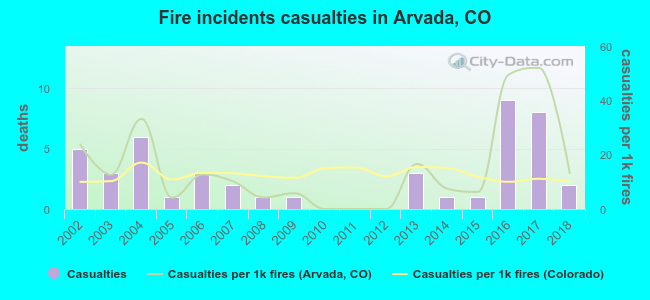 Based on the reports from the years 2002 - 2018 the average number of fire-related casualties per year is 3. The highest number of injuries - 9 took place in 2016, and the lowest - 0 in 2010. The data has a declining trend.
The average number of casualties per 1,000 fire incidents is 15. This indicator was the highest - 52 in 2017, and the lowest 0 in 2010. The trend for casualties per 1,000 fires is dropping. Compared to the Colorado value the number of injuries per 1,000 incidents is about the same.
Based on the reports from the years 2002 - 2018 the average number of fire-related casualties per year is 3. The highest number of injuries - 9 took place in 2016, and the lowest - 0 in 2010. The data has a declining trend.
The average number of casualties per 1,000 fire incidents is 15. This indicator was the highest - 52 in 2017, and the lowest 0 in 2010. The trend for casualties per 1,000 fires is dropping. Compared to the Colorado value the number of injuries per 1,000 incidents is about the same.Casualties per 1,000 incidents in Arvada, CO compared to nearest cities:
(Note: Based on data for all years, including only cities with at least 500 fire incidents)
| Arvada: | 13.9 |
| Wheat Ridge: | 9.2 |
| Westminster: | 34.0 |
| Federal Heights: | 21.2 |
| Golden: | 12.7 |
| Lakewood: | 36.1 |
| Broomfield: | 11.7 |
| Northglenn: | 9.4 |
| Denver: | 20.6 |
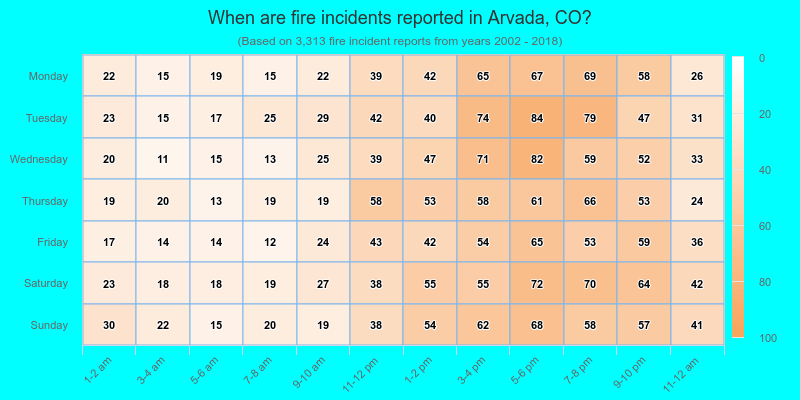
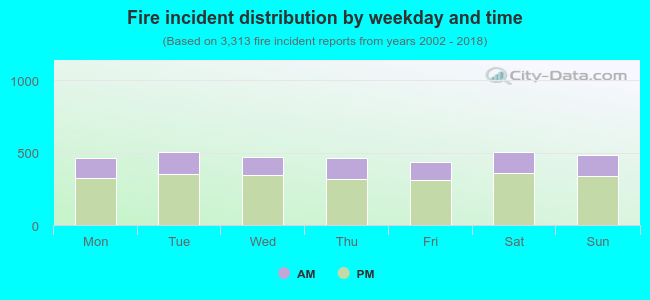 29.1% incidents where reported in the morning and 70.9% in the evening. The most fires (15.3%) took place on Tuesday, and the least (13.1%) on Friday.
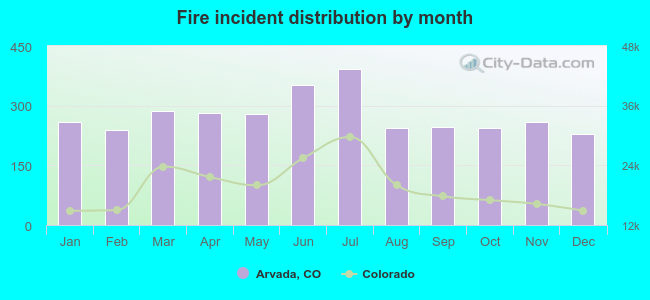 According to the 3,313 fire incident reports from years 2002 - 2018 most fires (11.8%) took place during July, and the least (6.9%) in December.
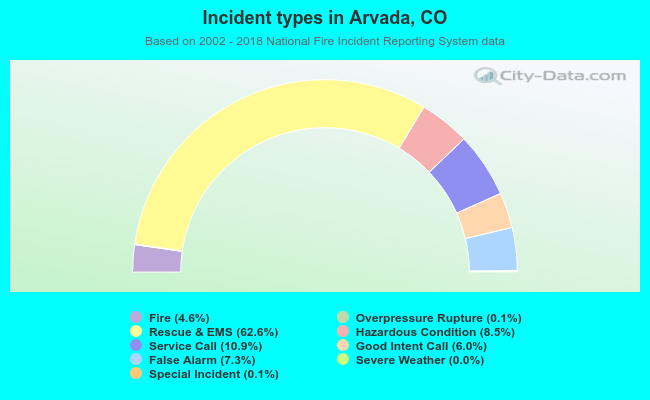 Out of all 72,617 cases reported during the years 2002 - 2018, the most belonged to the categories: Rescue & EMS (62.6%), Service Call (10.9%), and Hazardous Condition (8.5%).
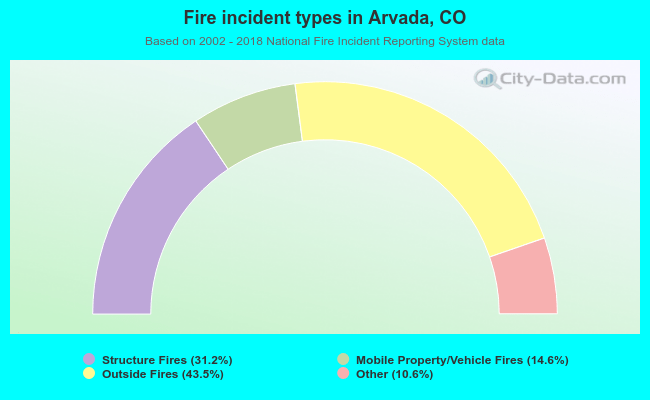 When looking into fire subcategories, the most reports belonged to: Outside Fires (43.5%), and Structure Fires (31.2%).