Ashland: Fire Incidents, Massachusetts (MA)
Where are fire incidents reported in Ashland, MA
Something went wrong! Please refresh the page.
|
| |||||||||||||||||||||||||||||||||||||||||||||||||||||||||||||||||||||||||||||||||||||||||||||||||||||||||||||
2002 - 2018 National Fire Incident Reporting System (NFIRS) incidents
- Incident types reported to NFIRS in Ashland, MA
- 4,22660.1%Rescue & EMS
- 97713.9%False Alarm
- 5057.2%Service Call
- 4816.8%Hazardous Condition
- 4326.1%Fire
- 3715.3%Good Intent Call
- 260.4%Special Incident
- 90.1%Severe Weather
- Fire incident types reported to NFIRS in Ashland, MA
- 22251.4%Structure Fires
- 15235.2%Outside Fires
- 409.3%Mobile Property/Vehicle Fires
- 184.2%Other
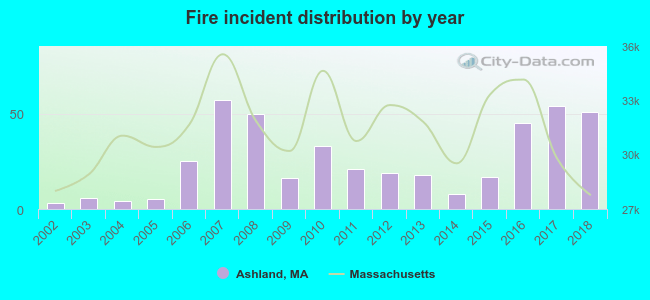 According to the data from the years 2002 - 2018 the average number of fire incidents per year is 25. The highest number of reported fire incidents - 57 took place in 2007, and the least - 3 in 2002. The data has an increasing trend.
The average number of yearly fire incidents per 10k residents in Ashland, MA compared to nearest cities:
(Note: Based on data for the last 3 years, including only cities with population 5,000 and above)
| Ashland: | 30.1 |
| Framingham: | 89.7 |
| Holliston: | 5.2 |
| Southborough: | 38.6 |
| Natick: | 25.0 |
| Medway: | 42.1 |
| Marlborough: | 31.4 |
| Wayland: | 19.2 |
| Millis: | 6.3 |
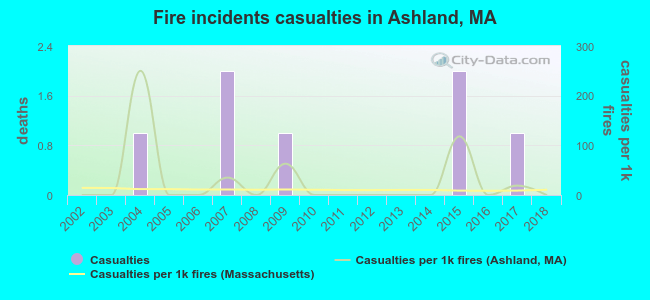 According to the data from the years 2002 - 2018 the average number of fire-related yearly casualties is 0. The highest number of reported casualties - 2 took place in 2007, and the lowest - 0 in 2002. The data has a constant trend.
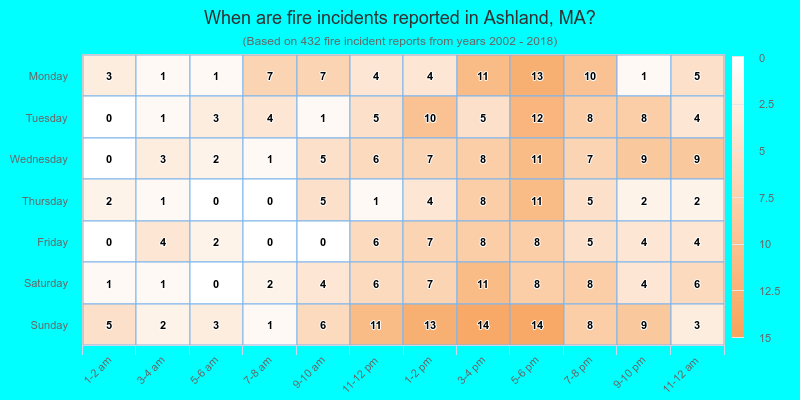
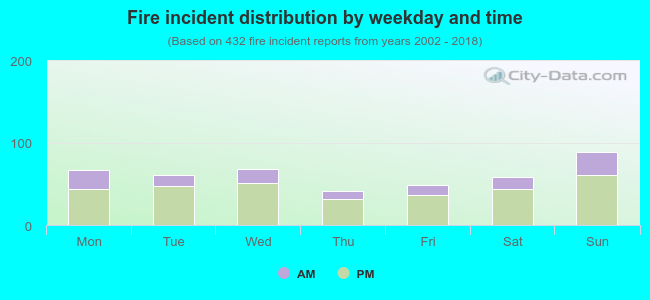 27.1% incidents where reported in the morning and 72.9% in the evening. The most fires (20.6%) took place on Sunday, and the least (9.5%) on Thursday.
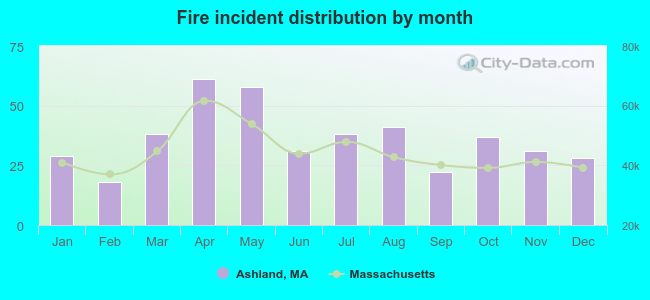 According to the 432 fire incident reports from years 2002 - 2018 most fires (14.1%) took place during April, and the least (4.2%) in February.
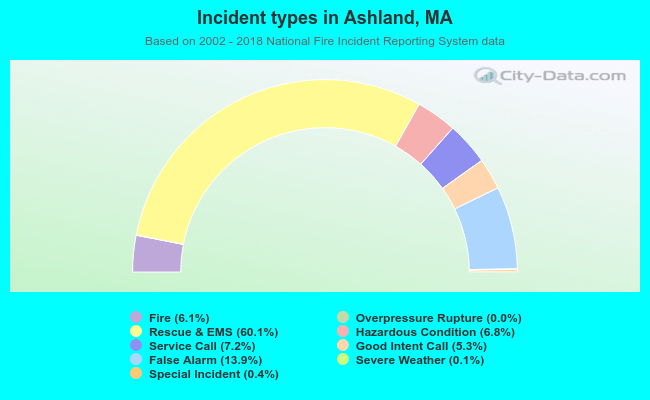 Out of all 7,028 cases reported during the years 2002 - 2018, the most belonged to the categories: Rescue & EMS (60.1%), False Alarm (13.9%), and Service Call (7.2%).
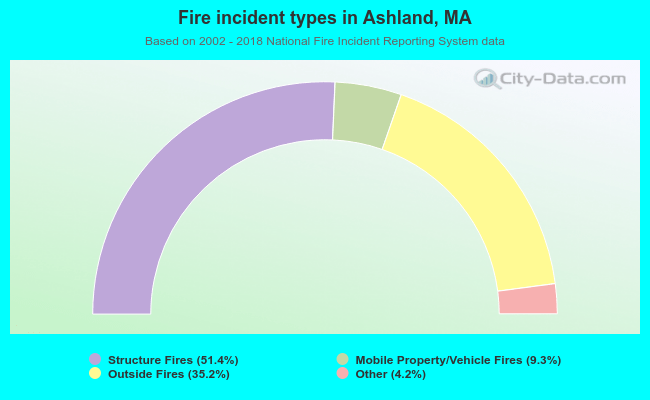 When looking into fire subcategories, the most incidents belonged to: Structure Fires (51.4%), and Outside Fires (35.2%).