Ashtabula: Fire Incidents, Ohio (OH)
Where are fire incidents reported in Ashtabula, OH
Something went wrong! Please refresh the page.
| Fire incidents reported | |
|---|---|
| Sreet name | Count |
| LAKE AVE | 530 |
| STATE RD | 216 |
| PROSPECT | 178 |
| 48TH ST | 174 |
| WEST AVE | 162 |
| NORTH RIDGE WEST | 152 |
| LAKE ROAD WEST | 146 |
| MAIN AVE | 144 |
| WOODMAN AVE | 140 |
| NORTH RIDGE RD | 136 |
| NORTH BEND ROAD | 122 |
| CENTER ROAD | 90 |
| STATION AVE | 90 |
| WEST PROSPECT ROAD | 84 |
| MICHIGAN AVE | 80 |
| WALNUT BLVD | 76 |
| COLUMBUS AVE | 74 |
| 90 HWY | 72 |
| JEFFERSON RD | 70 |
| EAST PROSPECT RD | 62 |
| PLYMOUTH RIDGE RD | 60 |
| BRIDGE ST | 58 |
| EUREKA RD | 58 |
| SANBORN ROAD | 58 |
| 6TH ST | 56 |
| BENEFIT AVE | 54 |
| 58TH ST | 52 |
| ANN AVE | 52 |
| 11 RT | 50 |
| ADAMS AVE | 48 |
| Other | 1,153 |
2002 - 2018 National Fire Incident Reporting System (NFIRS) incidents
- Incident types reported to NFIRS in Ashtabula, OH
- 9,98242.3%Rescue & EMS
- 4,49719.1%Fire
- 3,64915.5%Hazardous Condition
- 1,9928.4%Service Call
- 1,7447.4%False Alarm
- 1,5656.6%Good Intent Call
- 870.4%Severe Weather
- 480.2%Special Incident
- 340.1%Overpressure Rupture
- Fire incident types reported to NFIRS in Ashtabula, OH
- 2,07946.2%Outside Fires
- 1,90842.4%Structure Fires
- 49611.0%Mobile Property/Vehicle Fires
- 140.3%Other
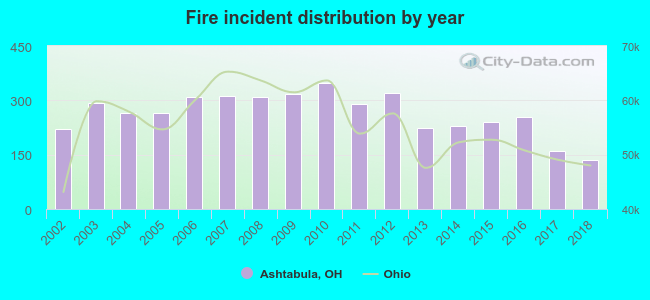 According to the data from the years 2002 - 2018 the average number of fire incidents per year is 265. The highest number of fires - 349 took place in 2010, and the least - 135 in 2018. The data has a declining trend.
The average number of yearly fire incidents per 10k residents in Ashtabula, OH compared to nearest cities:
(Note: Based on data for the last 3 years, including only cities with population 5,000 and above)
| Ashtabula: | 98.7 |
| Geneva: | 92.7 |
| Conneaut: | 78.8 |
| North Madison: | 1.2 |
| Painesville: | 54.8 |
| Chardon: | 147.8 |
| Mentor: | 21.3 |
| Kirtland: | 63.1 |
| Willoughby: | 58.9 |
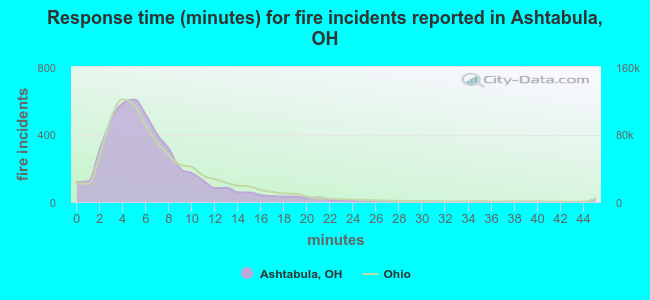 The median response time based on all reported fire incidents is 6 minutes. This is close to the Ohio median value.
The median response time in Ashtabula, OH compared to nearest cities:
(Note: Based on data for all years, including only cities with at least 500 fire incidents)
| Ashtabula: | 6 minutes |
| Geneva: | 7 minutes |
| Jefferson: | 10 minutes |
| Conneaut: | 5 minutes |
| Madison: | 7 minutes |
| Perry: | 6 minutes |
| Andover: | 10 minutes |
| Painesville: | 5 minutes |
| Chardon: | 7 minutes |
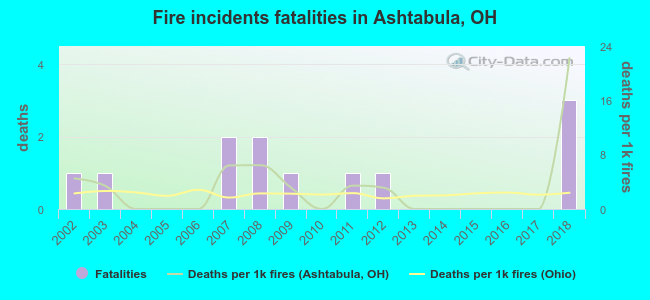 Based on the reports from the years 2002 - 2018 the average number of fire-related fatalities per year is 1. The highest number of deaths - 3 took place in 2018, and the lowest - 0 in 2004. The data has a rising trend.
The average number of fatalities per 1,000 fires is 3. This indicator was the highest - 22 in 2018, and the lowest 0 in 2004. The trend for fatalities per 1,000 incidents is increasing. Compared to the state value the number of fatalities per 1,000 fires is higher.
Based on the reports from the years 2002 - 2018 the average number of fire-related fatalities per year is 1. The highest number of deaths - 3 took place in 2018, and the lowest - 0 in 2004. The data has a rising trend.
The average number of fatalities per 1,000 fires is 3. This indicator was the highest - 22 in 2018, and the lowest 0 in 2004. The trend for fatalities per 1,000 incidents is increasing. Compared to the state value the number of fatalities per 1,000 fires is higher.Deaths per 1,000 incidents in Ashtabula, OH compared to nearest cities:
(Note: Based on data for all years, including only cities with at least 2,500 fire incidents)
| Ashtabula: | 2.7 |
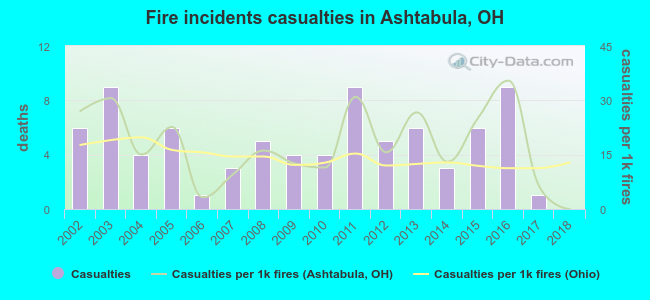 Based on the data from the years 2002 - 2018 the average number of fire-related yearly casualties is 5. The highest number of injuries - 9 took place in 2003, and the lowest - 0 in 2018. The data has a declining trend.
The average number of casualties per 1,000 fires is 18. This indicator was the highest - 35 in 2016, and the lowest 0 in 2018. The trend for injuries per 1,000 fires is decreasing. Compared to the Ohio value the number of casualties per 1,000 fires is higher.
Based on the data from the years 2002 - 2018 the average number of fire-related yearly casualties is 5. The highest number of injuries - 9 took place in 2003, and the lowest - 0 in 2018. The data has a declining trend.
The average number of casualties per 1,000 fires is 18. This indicator was the highest - 35 in 2016, and the lowest 0 in 2018. The trend for injuries per 1,000 fires is decreasing. Compared to the Ohio value the number of casualties per 1,000 fires is higher.
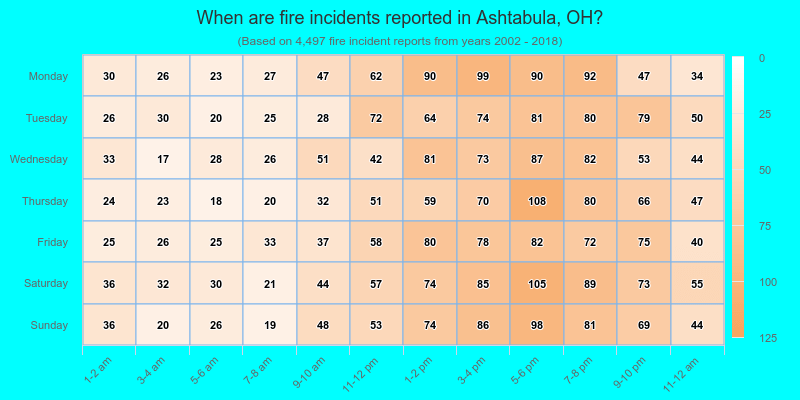
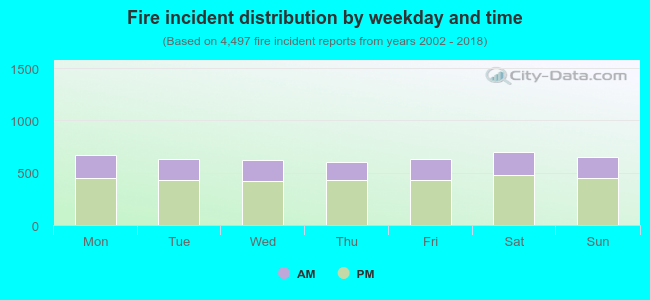 31.3% incidents where reported in the morning and 68.7% in the evening. The most fires (15.6%) took place on Saturday, and the least (13.3%) on Thursday.
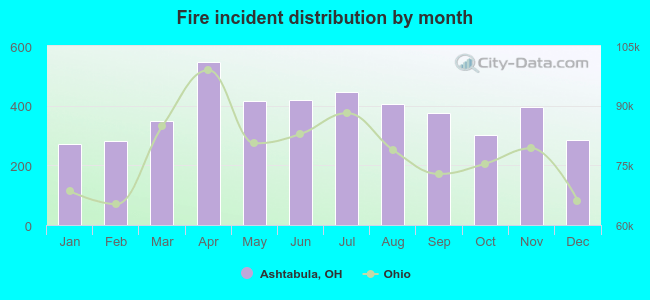 Based on the 4,497 fire incident reports from years 2002 - 2018 most fires (12.2%) took place during April, and the least (6.1%) in January.
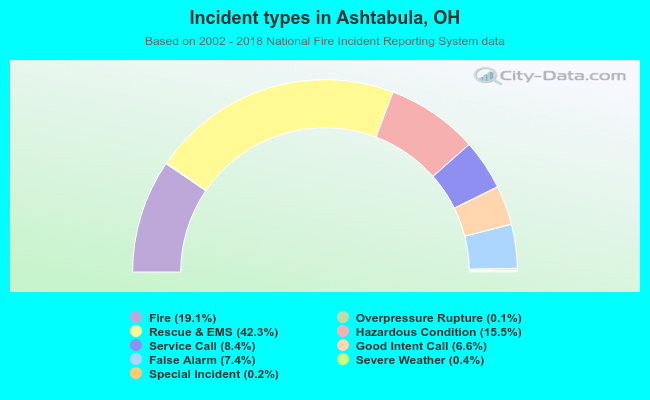 Out of all 23,598 cases reported during the years 2002 - 2018, the most belonged to the categories: Rescue & EMS (42.3%), Fire (19.1%), and Hazardous Condition (15.5%).
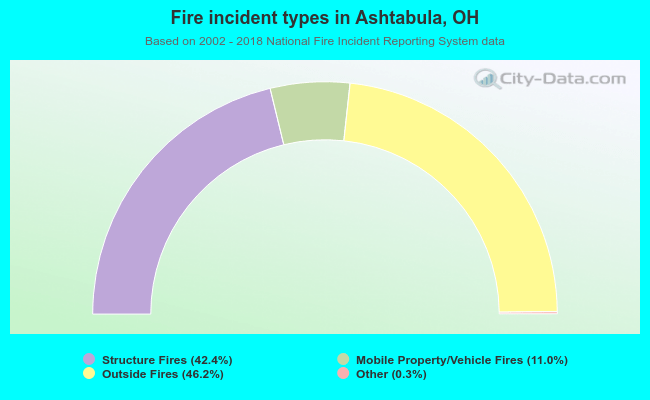 When looking into fire subcategories, the most reports belonged to: Outside Fires (46.2%), and Structure Fires (42.4%).