| Fire incidents reported |
|---|
| Sreet name | Count |
|---|
| OLD WIRE RD | 62 | | SMITH RIDGE RD | 32 | | HWY 62 | 18 | | SILVER CLOUD TRL | 18 | | CLOVERDALE RD | 16 | | SCENIC DR | 16 | | BATTLEFIELD RD | 14 | | INDIAN HILLS BLVD | 14 | | WALNUT VALLEY RD | 14 | | WOODS LODGE RD | 14 | | COOSE HOLLOW LN | 12 | | GRAMLING RD | 12 | | LANDERS RD | 12 | | SUGAR CREEK RD | 12 | | CAVEWOOD RD | 10 | | GUYLL RIDGE RD | 10 | | KISTLER RD | 10 | | ROSE ST | 10 | | WALNUT HILL RD | 10 | | AIRPORT LOOP | 8 | | CEMETERY RD | 8 | | COOSE HOLLOW DR | 8 | | HOLIDAY HILLS DR | 8 | | KAYS LN | 8 | | LESTER LN | 8 |
| | | Fire incidents reported |
|---|
| Sreet name | Count |
|---|
| RADER RD | 8 | | SMITH RIDGE TURNOFF | 8 | | TUCKS CHAPEL RD | 8 | | AMY AVE | 6 | | ANDY JACK RD | 6 | | DOGWOOD VALLEY RD | 6 | | GRAMBLING RD | 6 | | PEARL AVE | 6 | | SOUTHRIDGE RD | 6 | | BRYANT PL | 4 | | CARTOWN RD | 4 | | CIRCLE RD | 4 | | CLANCYS RD | 4 | | CLOVERDALE | 4 | | FIRE RUN RD | 4 | | GANN RIDGE RD | 4 | | HARRIS RD | 4 | | KELLIE CIR | 4 | | LAKESIDE DR | 4 | | LAKEWAY DR | 4 | | LIPPERT DR | 4 | | MAIN ST | 4 | | MIKE SCOTT RD | 4 | | MULDOON DR | 4 | | |
|
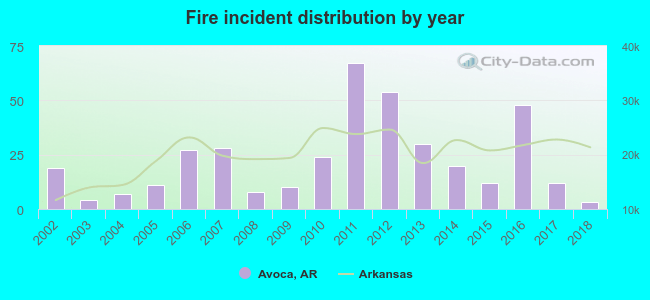 According to the data from the years 2002 - 2018 the average number of fire incidents per year is 23. The highest number of reported fire incidents - 67 took place in 2011, and the least - 3 in 2018. The data has a decreasing trend.
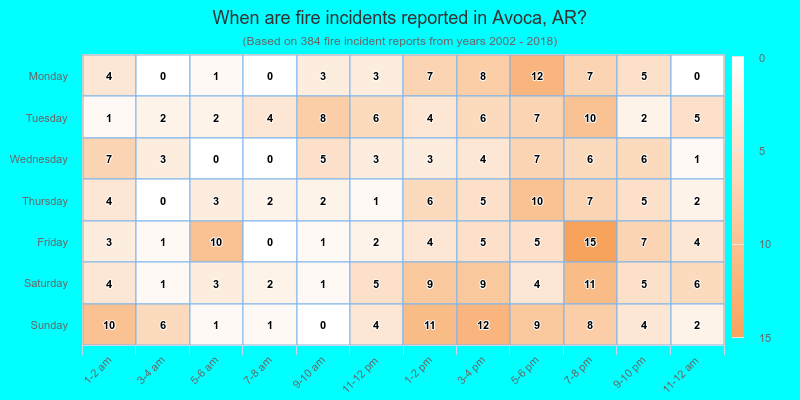
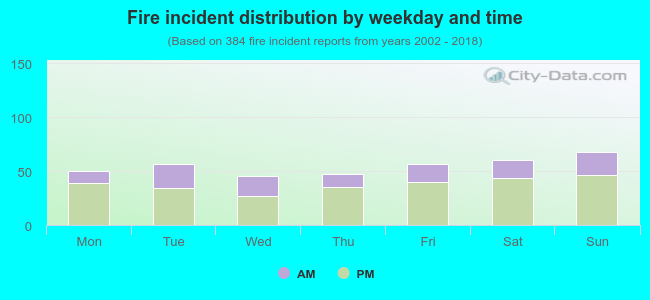 31.0% incidents where reported in the morning and 69.0% in the evening. The most fires (17.7%) took place on Sunday, and the least (11.7%) on Wednesday.
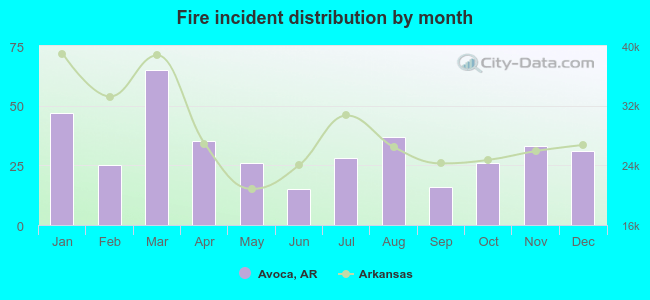 Based on the 384 fire incidents from years 2002 - 2018 most fires (16.9%) took place during March, and the least (3.9%) in June.
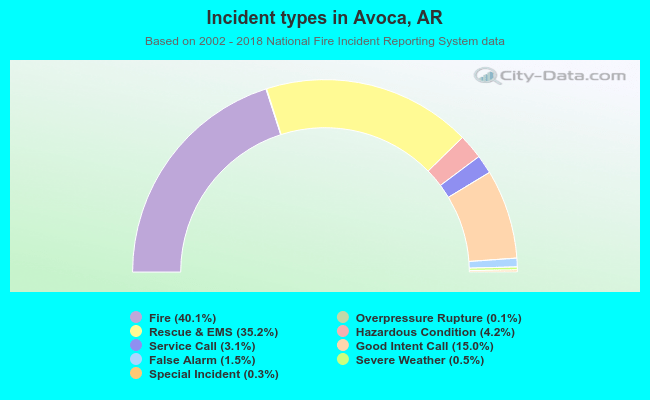 Out of all 958 cases reported during the years 2002 - 2018, the most belonged to the categories: Fire (40.1%), Rescue & EMS (35.2%), and Good Intent Call (15.0%).
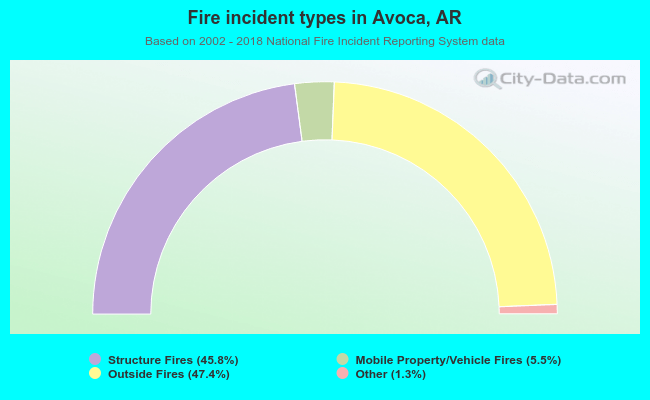 When looking into fire subcategories, the most incidents belonged to: Outside Fires (47.4%), and Structure Fires (45.8%).