Baldwinville: Fire Incidents, Massachusetts (MA)
Where are fire incidents reported in Baldwinville, MA
Something went wrong! Please refresh the page.
|
| |||||||||||||||||||||||||||||||||||||||||||||||||||||||||||||||||||||||||||||||||||||||||||||||||||||||||
2003 - 2017 National Fire Incident Reporting System (NFIRS) incidents
- Incident types reported to NFIRS in Baldwinville, MA
- 15842.8%Fire
- 7921.4%Service Call
- 4913.3%Hazardous Condition
- 338.9%Good Intent Call
- 246.5%Rescue & EMS
- 236.2%False Alarm
- 30.8%Special Incident
- Fire incident types reported to NFIRS in Baldwinville, MA
- 10163.9%Structure Fires
- 4729.7%Outside Fires
- 74.4%Mobile Property/Vehicle Fires
- 31.9%Other
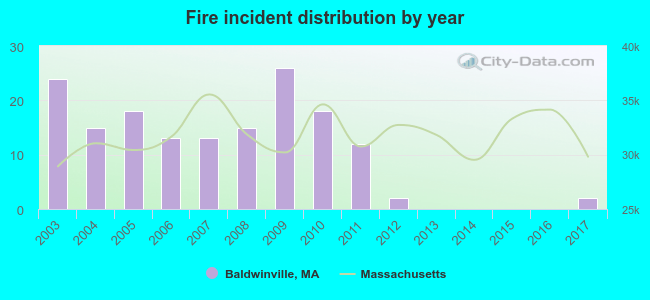 Based on the data from the years 2003 - 2017 the average number of fires per year is 11. The highest number of reported fire incidents - 26 took place in 2009, and the least - 0 in 2013. The data has a dropping trend.
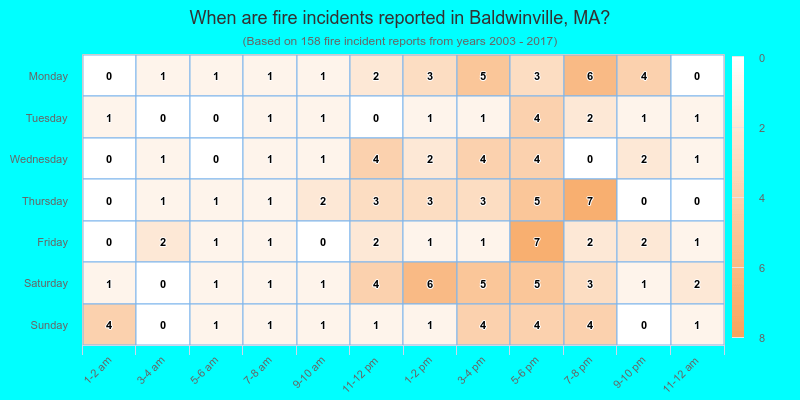
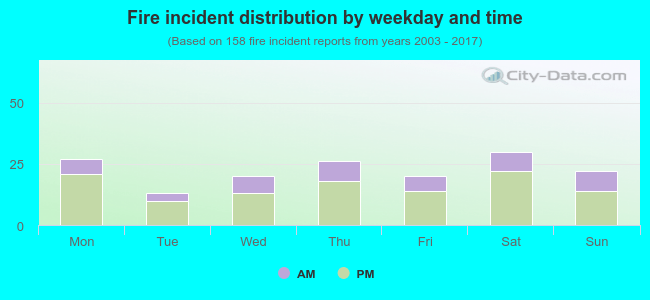 29.1% incidents where reported in the morning and 70.9% in the evening. The most fires (19.0%) took place on Saturday, and the least (8.2%) on Tuesday.
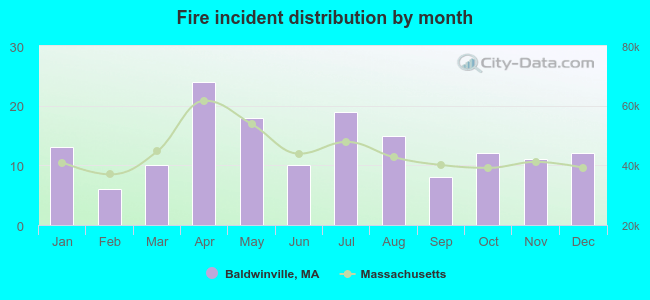 Based on the 158 fire incidents from years 2003 - 2017 most fires (15.2%) took place during April, and the least (3.8%) in February.
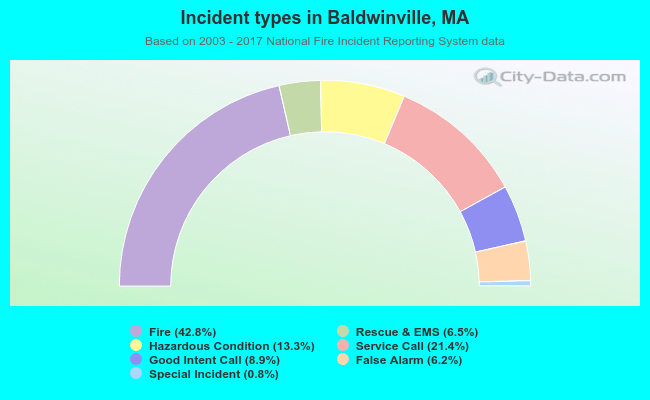 Out of all 369 cases reported during the years 2003 - 2017, the most belonged to the categories: Fire (42.8%), Hazardous Condition (21.4%), and Rescue & EMS (13.3%).
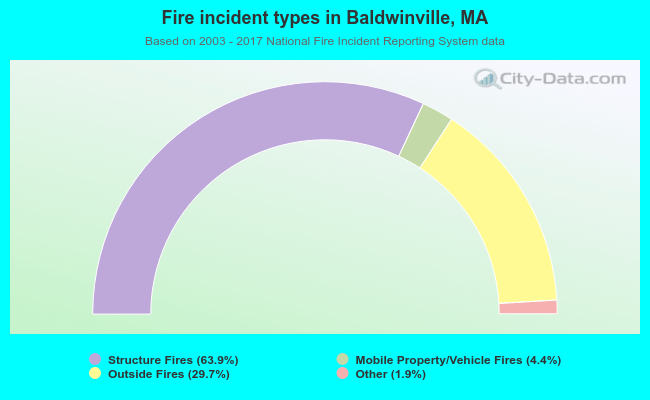 When looking into fire subcategories, the most incidents belonged to: Structure Fires (63.9%), and Outside Fires (29.7%).