Bangor: Fire Incidents, Pennsylvania (PA)
Where are fire incidents reported in Bangor, PA
Something went wrong! Please refresh the page.
|
| |||||||||||||||||||||||||||||||||||||||||||||||||||||||||||||||||||||||||||||||||||||||||||||||||||||||||||||
2003 - 2018 National Fire Incident Reporting System (NFIRS) incidents
- Incident types reported to NFIRS in Bangor, PA
- 36329.7%Hazardous Condition
- 29023.8%Rescue & EMS
- 21417.5%Fire
- 14812.1%Service Call
- 1078.8%False Alarm
- 786.4%Good Intent Call
- 110.9%Severe Weather
- 90.7%Special Incident
- Fire incident types reported to NFIRS in Bangor, PA
- 12056.1%Structure Fires
- 5525.7%Outside Fires
- 2411.2%Mobile Property/Vehicle Fires
- 157.0%Other
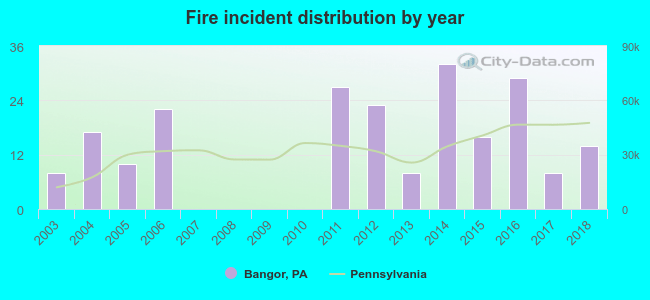 Based on the data from the years 2003 - 2018 the average number of fires per year is 13. The highest number of reported fires - 32 took place in 2014, and the least - 0 in 2007. The data has a rising trend.
The average number of yearly fire incidents per 10k residents in Bangor, PA compared to nearest cities:
(Note: Based on data for the last 3 years, including only cities with population 5,000 and above)
| Bangor: | 32.5 |
| Stroudsburg: | 52.4 |
| East Stroudsburg: | 39.8 |
| Nazareth: | 52.5 |
| Easton: | 77.1 |
| Wilson: | 3.2 |
| Bethlehem: | 29.6 |
| Northampton: | 71.3 |
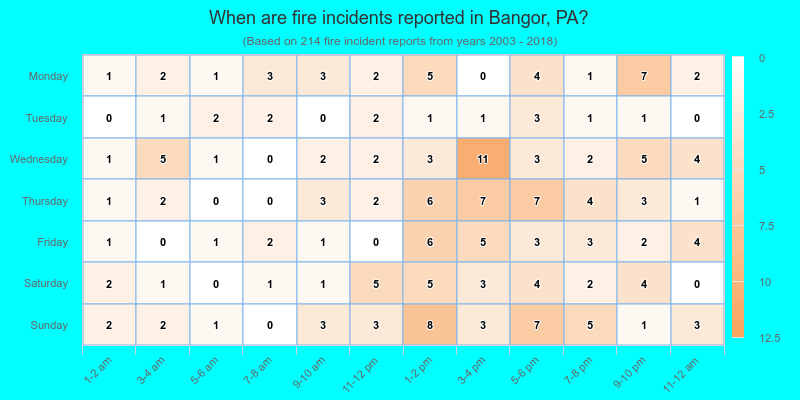
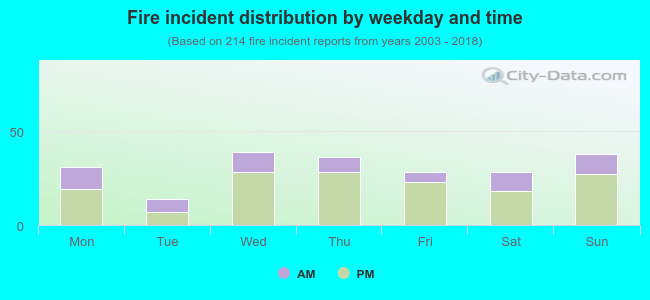 29.9% incidents where reported in the morning and 70.1% in the evening. The most fires (18.2%) took place on Wednesday, and the least (6.5%) on Tuesday.
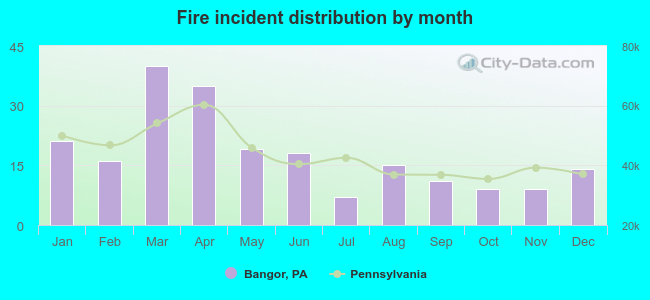 Based on the 214 reports from years 2003 - 2018 most fires (18.7%) took place during March, and the least (3.3%) in July.
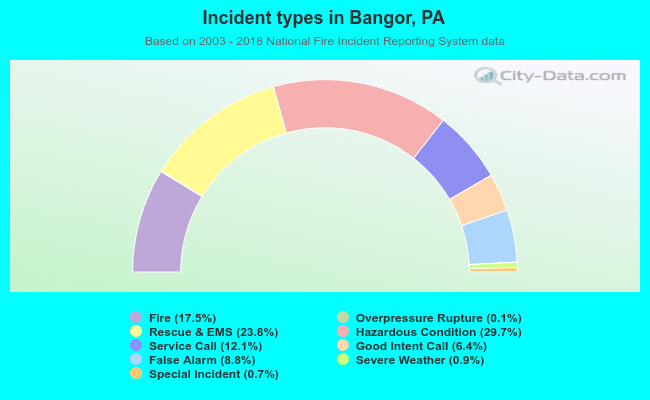 Out of all 1,221 cases reported during the years 2003 - 2018, the most belonged to the categories: Hazardous Condition (29.7%), Rescue & EMS (23.8%), and Fire (17.5%).
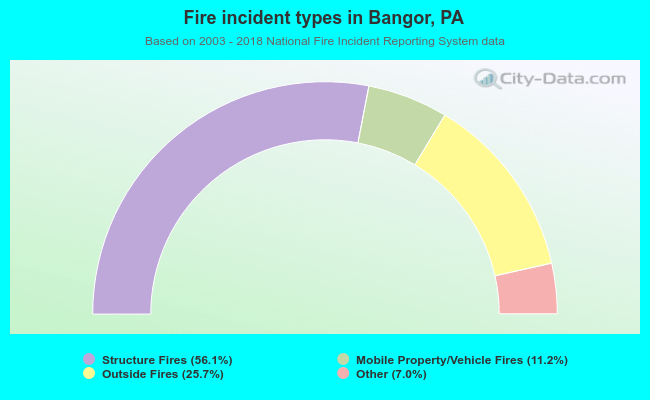 When looking into fire subcategories, the most incidents belonged to: Structure Fires (56.1%), and Outside Fires (25.7%).