| Fire incidents reported |
|---|
| Sreet name | Count |
|---|
| SUPERIOR AVE | 22 | | US41 | 16 | | LINDEMANN RD | 12 | | SPRUCE ST | 12 | | US-41 | 12 | | WESTLAND DR | 10 | | BELLAIRE RD | 8 | | LYONS ST | 8 | | MCGILLAN ST | 8 | | MICHIGAN AVE | 8 | | LINDBLOM RD | 6 | | M-38 | 6 | | M38 | 6 | | US HWY 41 | 6 | | 101 US HWY 41 S. | 4 | | 102 WADAGA ROAD | 4 | | 319 MCGILLAN STREET | 4 | | B-5138-E BELLAIRE ROAD | 4 | | BEARTOWN RD | 4 | | ELM ST | 4 | | MAIN ST | 4 | | MISSION RD | 4 | | MITCHELL ST | 4 | | OAK ST | 4 | | 101 US-41 | 2 |
| | | Fire incidents reported |
|---|
| Sreet name | Count |
|---|
| 102 BUCKLAND DRIVE | 2 | | 108 CARDINAL CIRCLE | 2 | | 121 MAIN STREET | 2 | | 14673 BELLAIRE ROAD | 2 | | 16134 MOYER ROAD | 2 | | 317 MCGILLAN STREET | 2 | | 338 MCGILLAN NKA B-5140-E CARL | 2 | | 412 MICHIGAN AVE | 2 | | 412 MICHIGAN AVE. | 2 | | 415 MICHIGAN AVE. | 2 | | 425 LYONS STREET | 2 | | 519 BOWLING AVE. | 2 | | 900 S. US HWY 41 | 2 | | ALSTON AVE | 2 | | ARNBIEN RD | 2 | | B-1900-N ARNHIEM ROAD | 2 | | B-4833-W PLAINS ROAD | 2 | | B-5101-E HAMER ROAD | 2 | | B-5115-E MOYER ROAD / RTE. 1, | 2 | | B-5800-E BELLAIRE ROAD | 2 | | B-986-N KROLICK ROAD | 2 | | BARAGA PLAINS RD | 2 | | BELAIRE RD | 2 | | GIRARD ST | 2 | | |
|
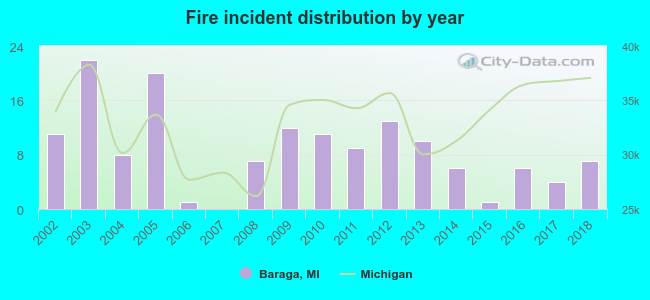 Based on the data from the years 2002 - 2018 the average number of fire incidents per year is 9. The highest number of reported fire incidents - 22 took place in 2003, and the least - 0 in 2007. The data has a declining trend.
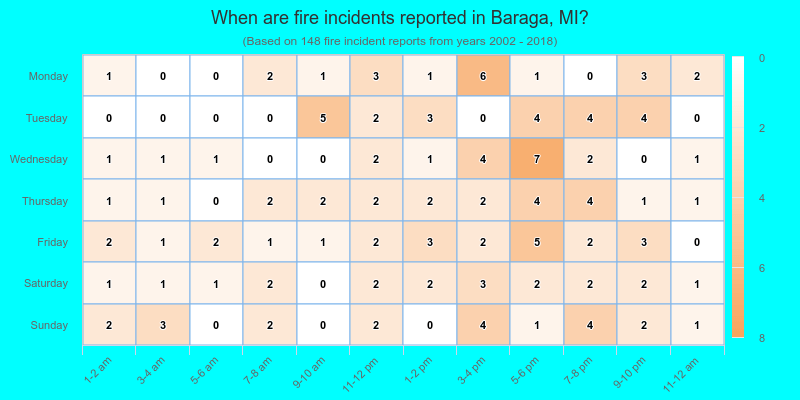
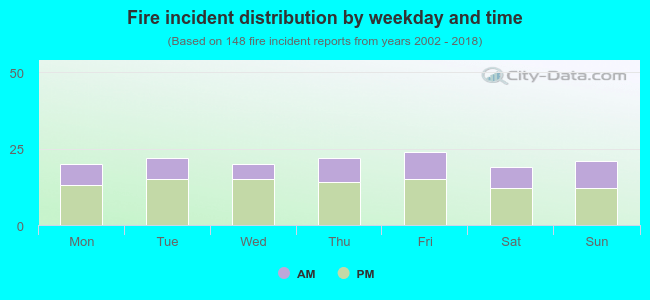 35.1% incidents where reported in the morning and 64.9% in the evening. The most fires (16.2%) took place on Friday, and the least (12.8%) on Saturday.
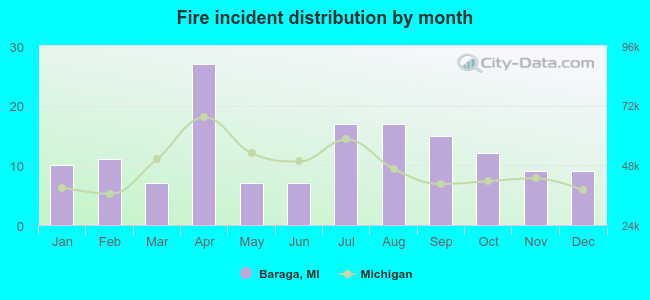 Based on the 148 fires from years 2002 - 2018 most fires (18.2%) took place during April, and the least (4.7%) in March.
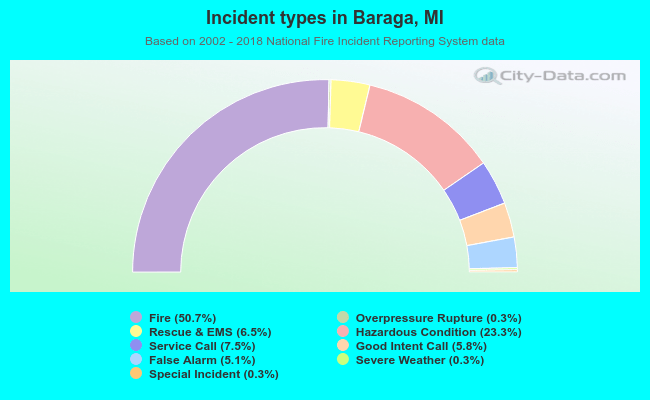 Out of all 292 cases reported during the years 2002 - 2018, the most belonged to the categories: Fire (50.7%), Hazardous Condition (23.3%), and Service Call (7.5%).
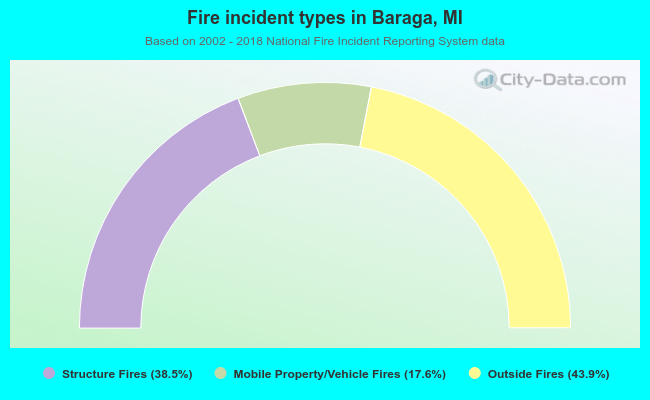 When looking into fire subcategories, the most reports belonged to: Outside Fires (43.9%), and Structure Fires (38.5%).