Battle Creek: Fire Incidents, Michigan (MI)
Where are fire incidents reported in Battle Creek, MI
Something went wrong! Please refresh the page.
| Fire incidents reported | |
|---|---|
| Sreet name | Count |
| CAPITAL AVE | 296 |
| MICHIGAN AVE | 260 |
| COLUMBIA AVE | 138 |
| NORTH AVE | 122 |
| BECKLEY RD | 88 |
| WASHINGTON AVE | 76 |
| RIVERSIDE DR | 66 |
| CLIFF ST | 54 |
| TERRITORIAL RD | 54 |
| VANBUREN ST | 50 |
| LATHROP AVE | 48 |
| STRINGHAM RD | 44 |
| BEDFORD RD | 42 |
| FOUNTAIN ST | 42 |
| I-94 HWY | 42 |
| RIVER RD | 42 |
| SPRINGVIEW DR | 40 |
| HAMBLIN AVE | 38 |
| BANFIELD RD | 36 |
| CHAMPION ST | 36 |
| CLAY ST | 36 |
| GOGUAC ST | 36 |
| I-94 | 36 |
| HELMER RD | 34 |
| MANCHESTER ST | 34 |
| 23RD ST | 32 |
| M-37 HWY | 32 |
| POST AVE | 32 |
| RITTENHOUSE AVE | 32 |
| TAFT CT | 32 |
| Other | 1,750 |
2002 - 2018 National Fire Incident Reporting System (NFIRS) incidents
- Incident types reported to NFIRS in Battle Creek, MI
- 28,74560.5%Rescue & EMS
- 4,81910.1%Good Intent Call
- 4,6379.8%Hazardous Condition
- 3,7007.8%Fire
- 2,9696.3%Service Call
- 2,4865.2%False Alarm
- 650.1%Overpressure Rupture
- 500.1%Special Incident
- Fire incident types reported to NFIRS in Battle Creek, MI
- 1,94952.7%Structure Fires
- 90524.5%Outside Fires
- 65617.7%Mobile Property/Vehicle Fires
- 1905.1%Other
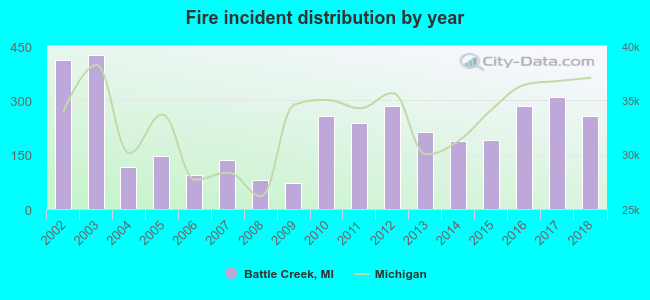 According to the data from the years 2002 - 2018 the average number of fires per year is 218. The highest number of reported fires - 425 took place in 2003, and the least - 72 in 2009. The data has a decreasing trend.
The average number of yearly fire incidents per 10k residents in Battle Creek, MI compared to nearest cities:
(Note: Based on data for the last 3 years, including only cities with population 5,000 and above)
| Battle Creek: | 54.7 |
| Springfield: | 46.1 |
| Marshall: | 75.8 |
| Kalamazoo: | 79.9 |
| Portage: | 23.9 |
| Albion: | 93.5 |
| Hastings: | 89.5 |
| Charlotte: | 81.7 |
| Coldwater: | 70.3 |
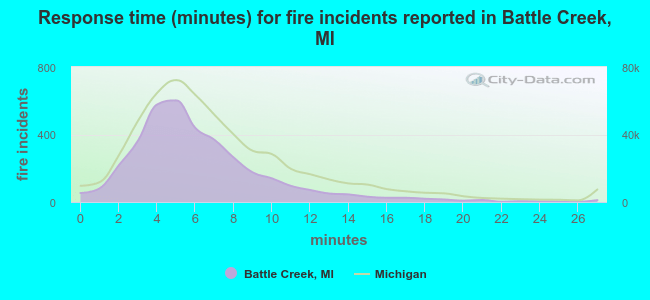 The median response time based on all reported fire incidents is 5 minutes. This is lower than the Michigan median value.
The median response time in Battle Creek, MI compared to nearest cities:
(Note: Based on data for all years, including only cities with at least 500 fire incidents)
| Battle Creek: | 5 minutes |
| Marshall: | 7 minutes |
| Richland: | 6 minutes |
| Delton: | 10 minutes |
| Union City: | 8 minutes |
| Kalamazoo: | 4 minutes |
| Portage: | 5 minutes |
| Vicksburg: | 8 minutes |
| Albion: | 5 minutes |
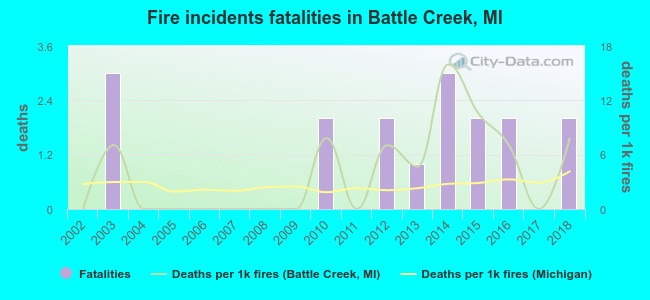 According to the data from the years 2002 - 2018 the average number of fire-related yearly deaths is 1. The highest number of deaths - 3 took place in 2003, and the lowest - 0 in 2002. The data has an increasing trend.
The average number of fatalities per 1,000 fire incidents is 4. This indicator was the highest - 16 in 2014, and the lowest 0 in 2002. The trend for fatalities per 1,000 fires is rising. Compared to the state value the number of deaths per 1,000 fires is higher.
According to the data from the years 2002 - 2018 the average number of fire-related yearly deaths is 1. The highest number of deaths - 3 took place in 2003, and the lowest - 0 in 2002. The data has an increasing trend.
The average number of fatalities per 1,000 fire incidents is 4. This indicator was the highest - 16 in 2014, and the lowest 0 in 2002. The trend for fatalities per 1,000 fires is rising. Compared to the state value the number of deaths per 1,000 fires is higher.Deaths per 1,000 incidents in Battle Creek, MI compared to nearest cities:
(Note: Based on data for all years, including only cities with at least 2,500 fire incidents)
| Battle Creek: | 4.6 |
| Kalamazoo: | 4.6 |
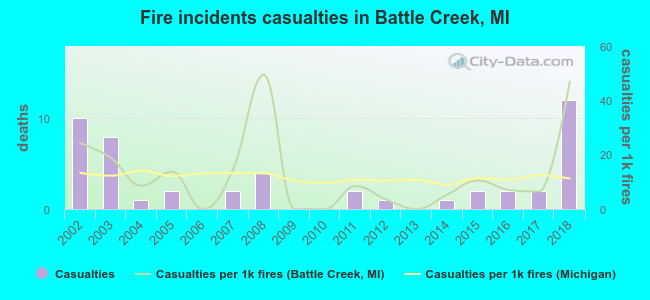 Based on the data from the years 2002 - 2018 the average number of fire-related yearly casualties is 3. The highest number of reported injuries - 12 took place in 2018, and the lowest - 0 in 2006. The data has a growing trend.
The average number of casualties per 1,000 fire incidents is 13. This indicator was the highest - 49 in 2008, and the lowest 0 in 2006. The trend for injuries per 1,000 fire incidents is rising. Compared to the Michigan value the number of injuries per 1,000 fire incidents is similar.
Based on the data from the years 2002 - 2018 the average number of fire-related yearly casualties is 3. The highest number of reported injuries - 12 took place in 2018, and the lowest - 0 in 2006. The data has a growing trend.
The average number of casualties per 1,000 fire incidents is 13. This indicator was the highest - 49 in 2008, and the lowest 0 in 2006. The trend for injuries per 1,000 fire incidents is rising. Compared to the Michigan value the number of injuries per 1,000 fire incidents is similar.
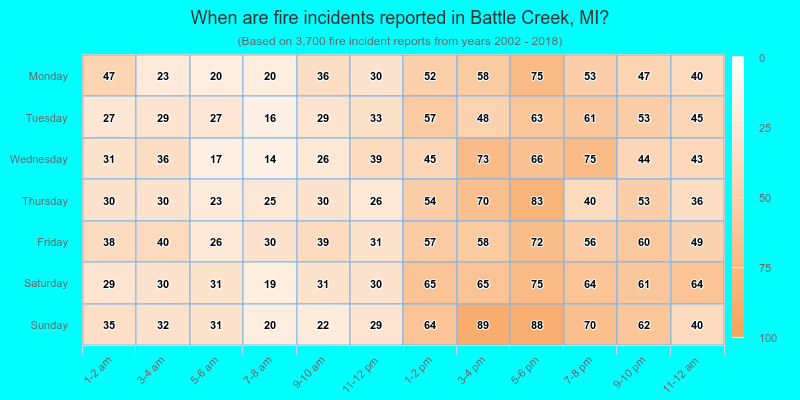
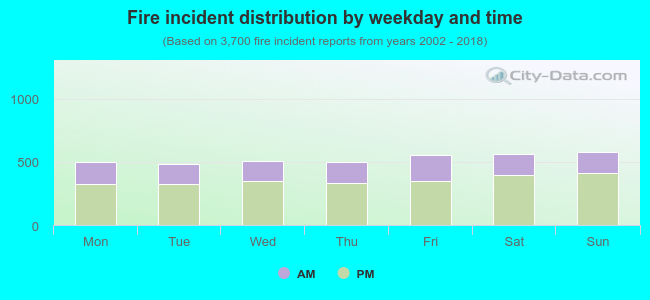 32.6% incidents where reported in the morning and 67.4% in the evening. The most fires (15.7%) took place on Sunday, and the least (13.2%) on Tuesday.
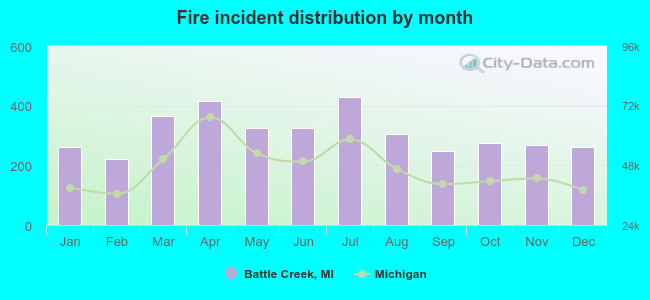 Based on the 3,700 fire incident reports from years 2002 - 2018 most fires (11.6%) took place during July, and the least (6.0%) in February.
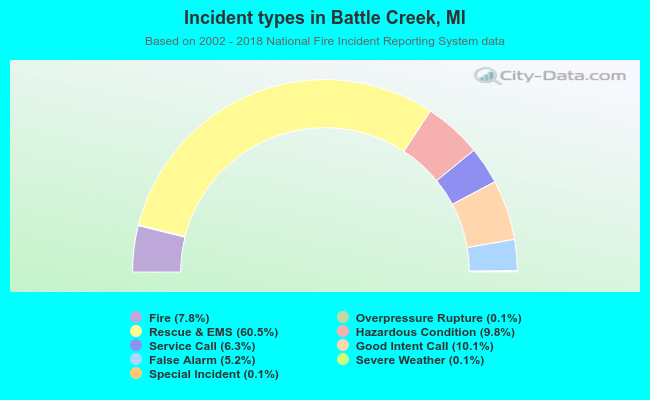 Out of all 47,498 cases reported during the years 2002 - 2018, the most belonged to the categories: Rescue & EMS (60.5%), Good Intent Call (10.1%), and Hazardous Condition (9.8%).
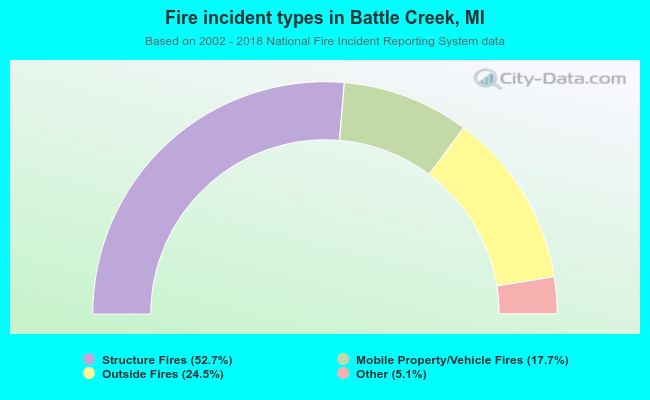 When looking into fire subcategories, the most reports belonged to: Structure Fires (52.7%), and Outside Fires (24.5%).