Battle Ground: Fire Incidents, Washington (WA)
Where are fire incidents reported in Battle Ground, WA
Something went wrong! Please refresh the page.
| Fire incidents reported | |
|---|---|
| Sreet name | Count |
| MAIN ST | 194 |
| 72ND AVE | 94 |
| 219TH ST | 78 |
| 199TH ST | 72 |
| 179TH ST | 56 |
| GRACE AVE | 54 |
| PARKWAY AVE | 54 |
| LEWISVILLE HWY | 50 |
| 12TH AVE | 48 |
| 92ND AVE | 46 |
| 239TH ST | 42 |
| 10TH AVE | 40 |
| 259TH ST | 30 |
| 20TH AVE | 28 |
| 112TH AVE | 26 |
| 29TH AVE | 26 |
| 50TH AVE | 26 |
| 13TH AVE | 24 |
| 279TH ST | 24 |
| 4TH ST | 24 |
| 244TH ST | 22 |
| EATON BLVD | 22 |
| 10TH ST | 20 |
| 122ND AVE | 20 |
| 1ST ST | 20 |
| 269TH ST | 20 |
| 2ND AVE | 20 |
| 3RD ST | 20 |
| 6TH ST | 20 |
| 82ND AVE | 20 |
| Other | 262 |
2003 - 2018 National Fire Incident Reporting System (NFIRS) incidents
- Incident types reported to NFIRS in Battle Ground, WA
- 9,55061.9%Rescue & EMS
- 2,19914.3%Good Intent Call
- 1,5029.7%Fire
- 1,0056.5%Service Call
- 5673.7%Hazardous Condition
- 5503.6%False Alarm
- 310.2%Special Incident
- Fire incident types reported to NFIRS in Battle Ground, WA
- 71047.3%Outside Fires
- 46230.8%Structure Fires
- 17911.9%Mobile Property/Vehicle Fires
- 15110.1%Other
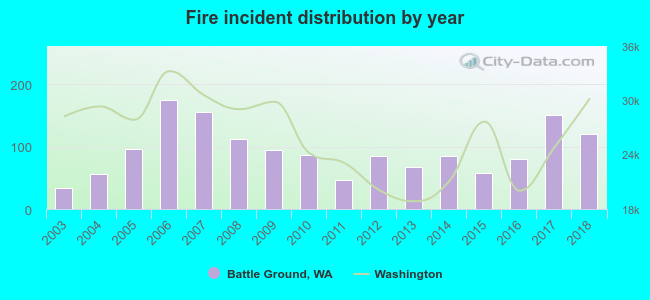 According to the data from the years 2003 - 2018 the average number of fire incidents per year is 94. The highest number of reported fire incidents - 174 took place in 2006, and the least - 34 in 2003. The data has an increasing trend.
The average number of yearly fire incidents per 10k residents in Battle Ground, WA compared to nearest cities:
(Note: Based on data for the last 3 years, including only cities with population 5,000 and above)
| Battle Ground: | 61.6 |
| Ridgefield: | 110.5 |
| Hazel Dell: | 4.1 |
| Vancouver: | 40.5 |
| Woodland: | 66.0 |
| Camas: | 32.8 |
| Washougal: | 45.1 |
| Rose Valley: | 4.0 |
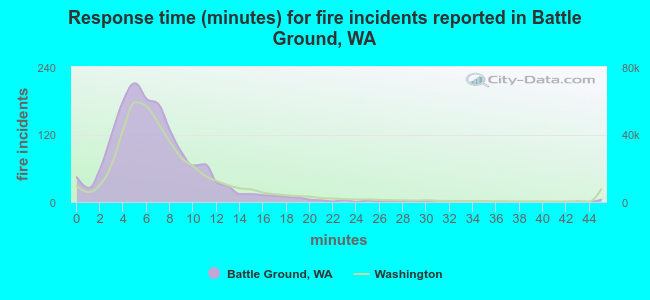 The median response time based on all reported fire incidents is 6 minutes. This is about the same as the state median value.
The median response time in Battle Ground, WA compared to nearest cities:
(Note: Based on data for all years, including only cities with at least 500 fire incidents)
| Battle Ground: | 6 minutes |
| Brush Prairie: | 7 minutes |
| Ridgefield: | 7 minutes |
| Vancouver: | 6 minutes |
| Woodland: | 7 minutes |
| Camas: | 7 minutes |
| Scappoose: | 8 minutes |
| Washougal: | 7 minutes |
| Portland: | 5 minutes |
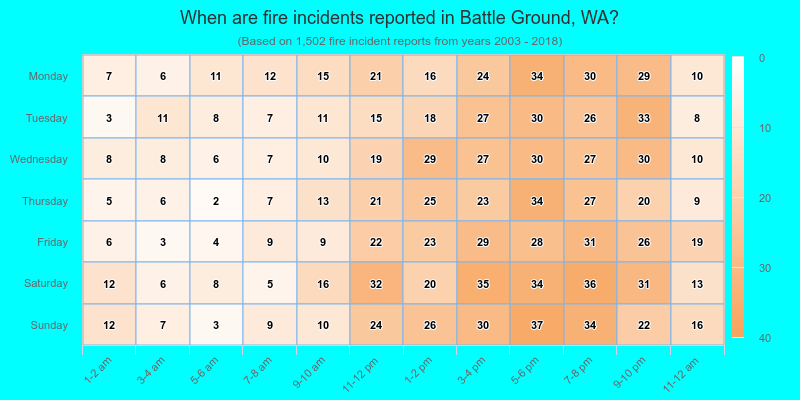
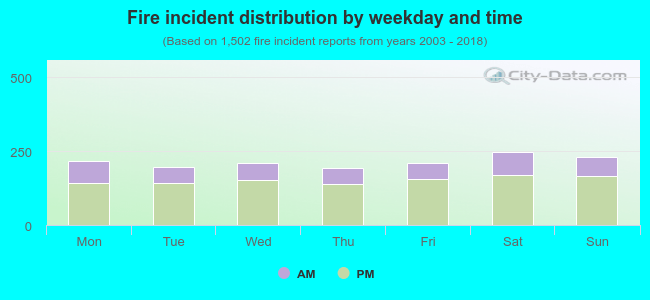 29.0% incidents where reported in the morning and 71.0% in the evening. The most fires (16.5%) took place on Saturday, and the least (12.8%) on Thursday.
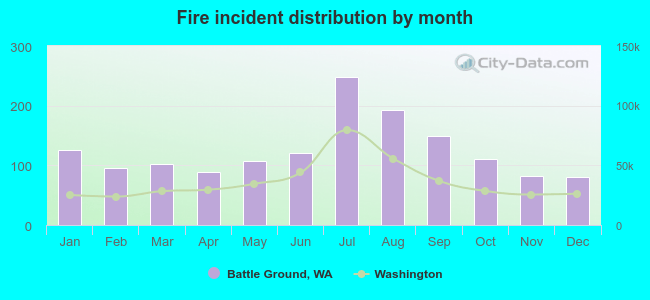 According to the 1,502 fire incidents from years 2003 - 2018 most fires (16.5%) took place during July, and the least (5.3%) in December.
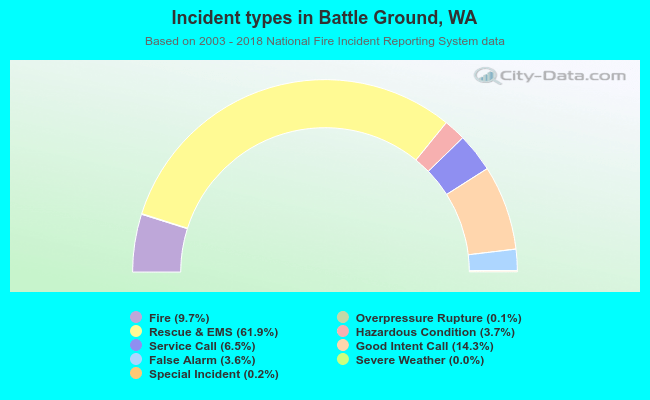 Out of all 15,421 cases reported during the years 2003 - 2018, the most belonged to the categories: Rescue & EMS (61.9%), Good Intent Call (14.3%), and Fire (9.7%).
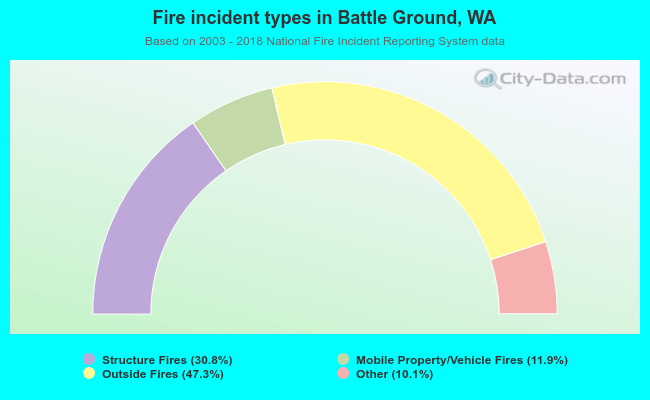 When looking into fire subcategories, the most incidents belonged to: Outside Fires (47.3%), and Structure Fires (30.8%).