| Fire incidents reported |
|---|
| Sreet name | Count |
|---|
| 304 HWY | 14 | | HWY 304 | 14 | | NEALS CREEK RD | 14 | | SWAN POINT RD | 14 | | MILL POND RD | 12 | | NC 304 HWY | 10 | | HWY 55 | 8 | | RICH AVE | 8 | | SWAN POINT RD | 8 | | TINGLE AVE | 8 | | WATER STREET | 8 | | CHINCHILLA DR | 6 | | NC 55 HWY | 6 | | NEALS CREEK RD | 6 | | 206 FIFTH ST | 4 | | 211 WATER ST | 4 | | 55 HWY | 4 | | 6714 HWY 304 | 4 | | 8319 HWY 304 | 4 | | ALFRED RD | 4 | | ALLIGATOR CREEK RD | 4 | | BAY CITY ROAD | 4 | | BAYCITY RD | 4 | | CD LN | 4 | | COWELL LOOP RD | 4 |
| | | Fire incidents reported |
|---|
| Sreet name | Count |
|---|
| COWELL LOOP RD. | 4 | | HARPER RD | 4 | | HERBERT LN | 4 | | LYNCHS BEACH RD | 4 | | MAIN ST | 4 | | MAIN ST | 4 | | MATTHEWS RD | 4 | | NC HWY 55 HWY | 4 | | SEAWELL LOOP RD | 4 | | SWAN POINT ROAD | 4 | | UPPER NECK RD | 4 | | VANCE ST | 4 | | VANCE STREET | 4 | | WATER ST | 4 | | WILLIS ST | 4 | | 101 RAWLS STREET | 2 | | 102 CD LANE | 2 | | 1041 UPPER NECK RD | 2 | | 106 TINGLE AVE | 2 | | 108 GRAISON LANE | 2 | | 1097 HWY 304 | 2 | | 112 TINGLE AVE. | 2 | | 11393 NC HWY 304 | 2 | | 114 LYNCHES BEACH ROAD | 2 | | |
|
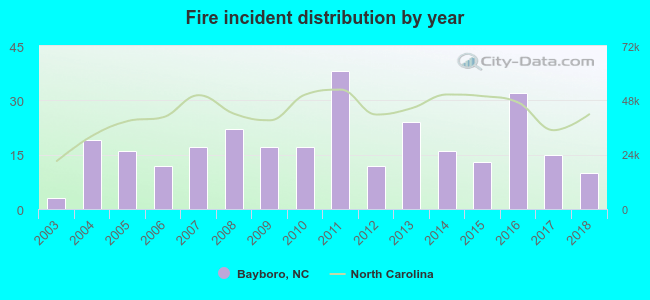 Based on the data from the years 2003 - 2018 the average number of fires per year is 18. The highest number of fires - 38 took place in 2011, and the least - 3 in 2003. The data has a rising trend.
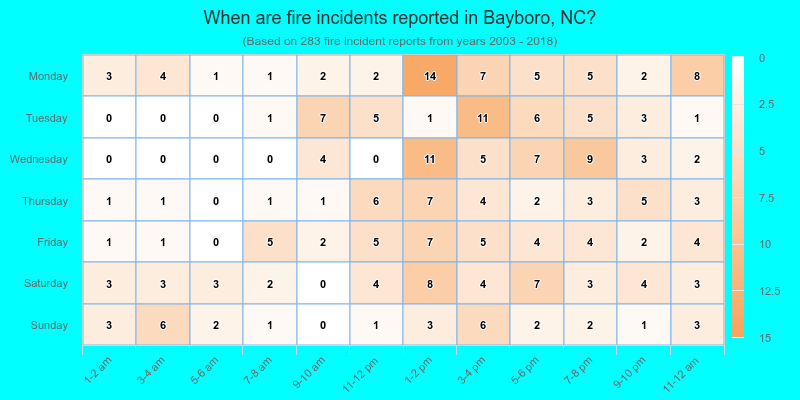
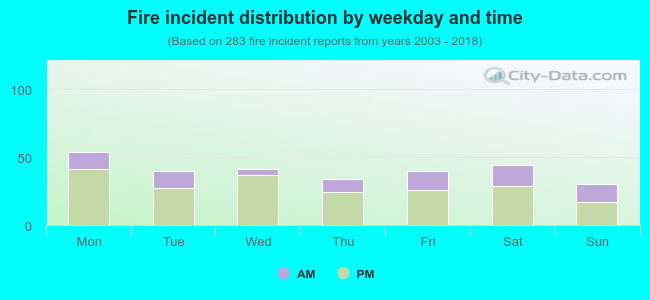 29.0% incidents where reported in the morning and 71.0% in the evening. The most fires (19.1%) took place on Monday, and the least (10.6%) on Sunday.
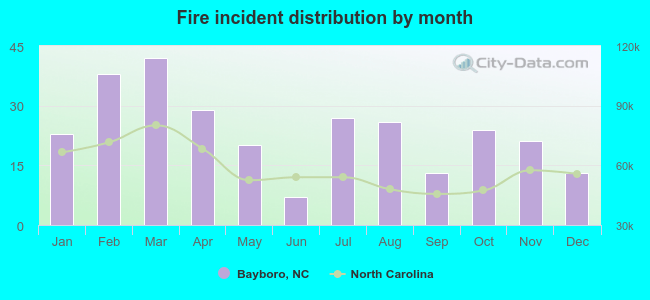 According to the 283 fire incident reports from years 2003 - 2018 most fires (14.8%) took place during March, and the least (2.5%) in June.
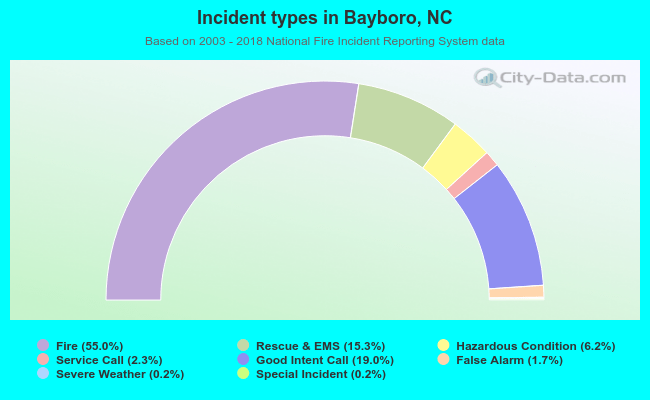 Out of all 515 cases reported during the years 2003 - 2018, the most belonged to the categories: Fire (55.0%), Service Call (19.0%), and Overpressure Rupture (15.3%).
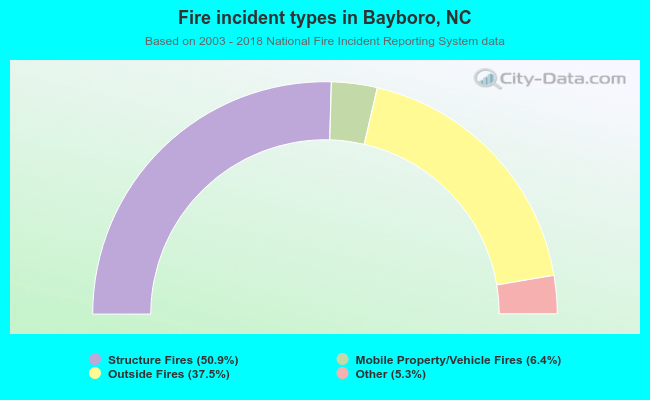 When looking into fire subcategories, the most incidents belonged to: Structure Fires (50.9%), and Outside Fires (37.5%).