| Fire incidents reported |
|---|
| Sreet name | Count |
|---|
| FM 2354 | 68 | | KENDALL RD | 10 | | OCEAN DR | 10 | | BAYVIEW DR | 8 | | POINT BARROW RD | 8 | | FM 2354 HWY | 6 | | FM2354 | 6 | | HARBOR LN | 6 | | WALKER LN | 6 | | BAYSIDE DR | 4 | | LAKEVIEW DR @ RWJ | 4 | | LAWRENCE | 4 | | LENNIE LANE RD | 4 | | MADISON | 4 | | MCCOLLUM PARK | 4 | | 11812 CEDARGULLY | 2 | | 7030 FM 2354 56E | 2 | | 7919 BAYVIEW DR | 2 | | ATLANTIC PIPELINE RD | 2 | | BAYSIDE | 2 | | BAYSIDE DRIVE RD | 2 | | CEDAR GULLY RD | 2 | | CEDAR GULLY RD. | 2 | | CEDAR POINT #1 | 2 | | CEDAR POINT RD | 2 |
| | | Fire incidents reported |
|---|
| Sreet name | Count |
|---|
| CEDAR POINT RD | 2 | | CLARK | 2 | | DOW REEF DR | 2 | | FISHER DR | 2 | | FM 1405 | 2 | | FM 2354 AT BAY PLACE | 2 | | FM 2354 AT HURST | 2 | | FM 2354 MACKRELL | 2 | | JORDAN DR | 2 | | KAI DR | 2 | | KENDALL DR | 2 | | KENDALL ROAD RD | 2 | | LAKEVIEW DR | 2 | | LAWRENCE RD | 2 | | LENNIE LN | 2 | | LENNIE LN. LN | 2 | | MADISON AVE | 2 | | MCCULLUM PARK RD RD | 2 | | NORTH POINT | 2 | | OAKS AT HOUSTON POINT | 2 | | OCEAN DR | 2 | | OCEAN DR. | 2 | | OCEAN DRIVE | 2 | | POINT BARROW | 2 | | S.H. 99 @ FISHER RD. | 2 |
|
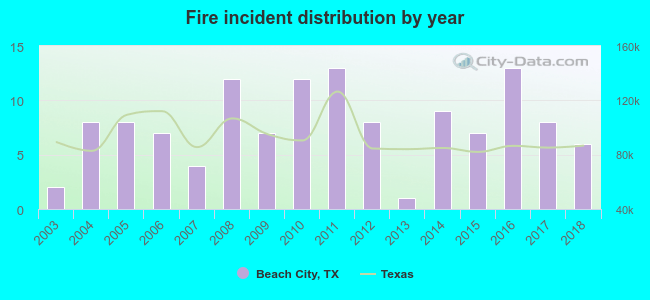 Based on the data from the years 2003 - 2018 the average number of fire incidents per year is 8. The highest number of fires - 13 took place in 2011, and the least - 1 in 2013. The data has an increasing trend.
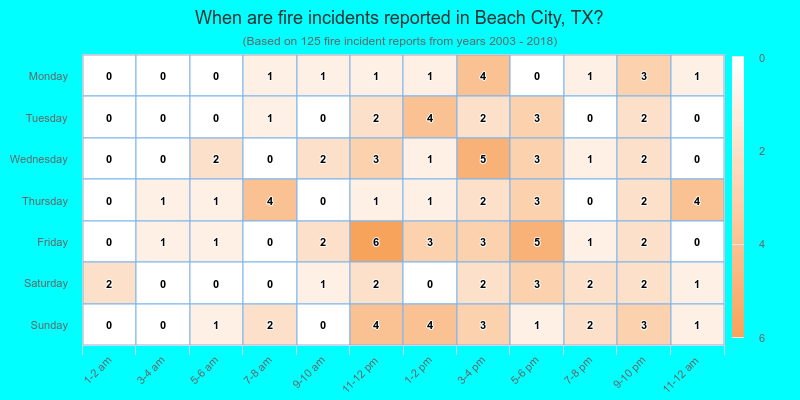
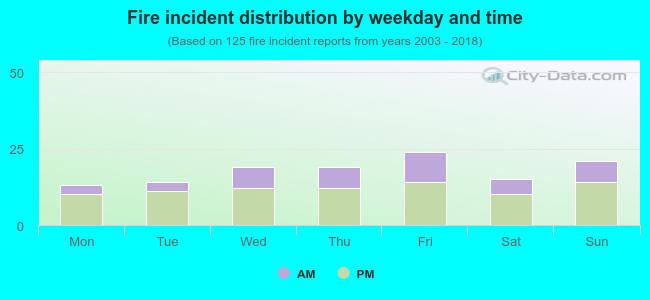 33.6% incidents where reported in the morning and 66.4% in the evening. The most fires (19.2%) took place on Friday, and the least (10.4%) on Monday.
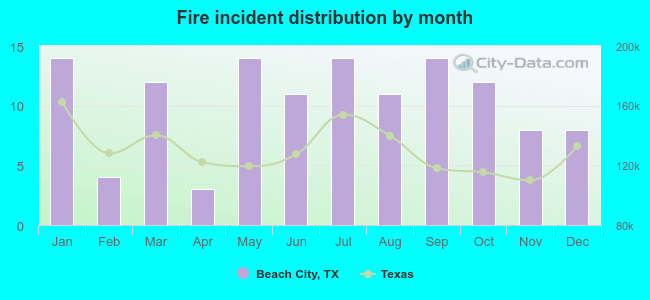 According to the 125 fire incidents from years 2003 - 2018 most fires (11.2%) took place during January, and the least (2.4%) in April.
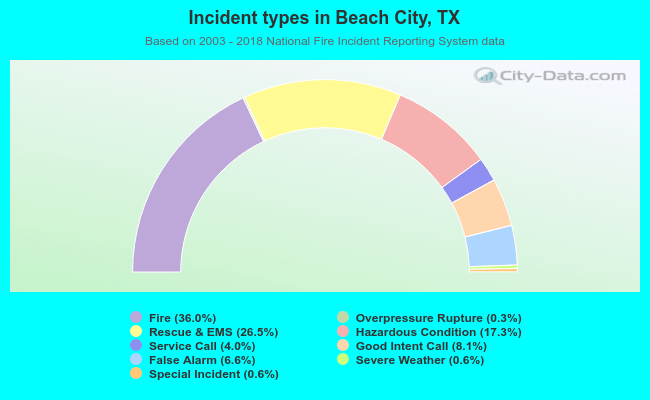 Out of all 347 cases reported during the years 2003 - 2018, the most belonged to the categories: Fire (36.0%), Rescue & EMS (26.5%), and Hazardous Condition (17.3%).
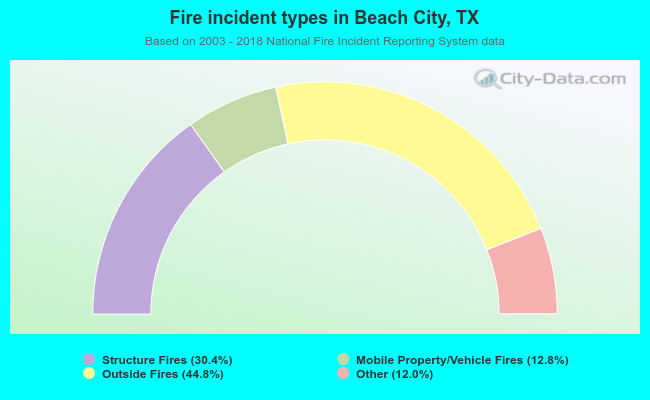 When looking into fire subcategories, the most reports belonged to: Outside Fires (44.8%), and Structure Fires (30.4%).