Beachwood: Fire Incidents, Ohio (OH)
Where are fire incidents reported in Beachwood, OH
Something went wrong! Please refresh the page.
|
| |||||||||||||||||||||||||||||||||||||||||||||||||||||||||||||||||||||||||||||||||||||||||||||||||||||||||||||
2002 - 2018 National Fire Incident Reporting System (NFIRS) incidents
- Incident types reported to NFIRS in Beachwood, OH
- 10,14059.9%Rescue & EMS
- 2,39814.2%False Alarm
- 2,36114.0%Hazardous Condition
- 7144.2%Good Intent Call
- 6824.0%Fire
- 6043.6%Service Call
- Fire incident types reported to NFIRS in Beachwood, OH
- 28241.3%Structure Fires
- 24636.1%Outside Fires
- 15022.0%Mobile Property/Vehicle Fires
- 40.6%Other
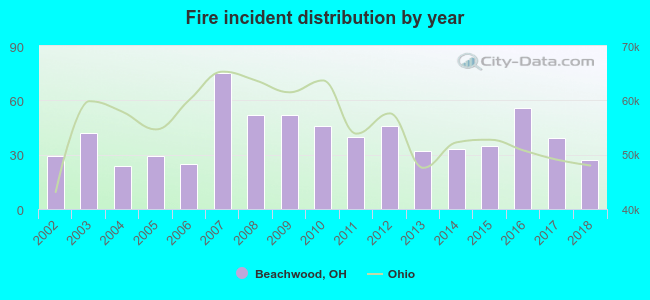 Based on the data from the years 2002 - 2018 the average number of fires per year is 40. The highest number of reported fires - 75 took place in 2007, and the least - 24 in 2004. The data has a declining trend.
The average number of yearly fire incidents per 10k residents in Beachwood, OH compared to nearest cities:
(Note: Based on data for the last 3 years, including only cities with population 5,000 and above)
| Beachwood: | 34.5 |
| Pepper Pike: | 24.7 |
| University Heights: | 50.2 |
| Shaker Heights: | 34.3 |
| Lyndhurst: | 28.4 |
| South Euclid: | 30.5 |
| Warrensville Heights: | 5.3 |
| Mayfield Heights: | 26.7 |
| Cleveland Heights: | 40.4 |
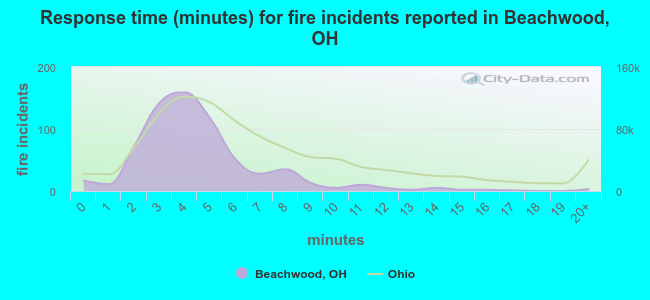 The median response time based on all reported fire incidents is 4 minutes. This is lower than the Ohio median value.
The median response time in Beachwood, OH compared to nearest cities:
(Note: Based on data for all years, including only cities with at least 500 fire incidents)
| Beachwood: | 4 minutes |
| University Heights: | 5 minutes |
| Shaker Heights: | 4 minutes |
| Lyndhurst: | 5 minutes |
| South Euclid: | 6 minutes |
| Mayfield Heights: | 4 minutes |
| Cleveland Heights: | 5 minutes |
| East Cleveland: | 3 minutes |
| Bedford: | 4 minutes |
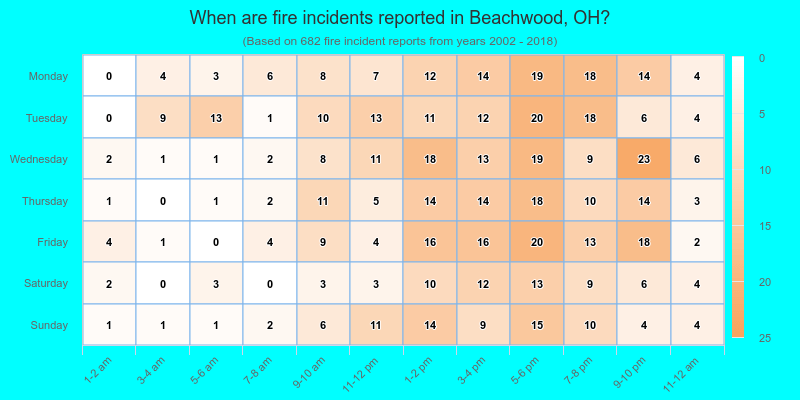
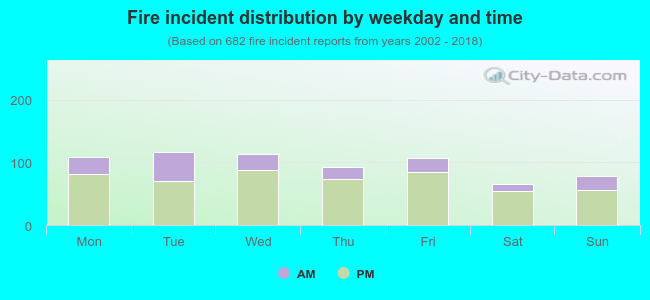 25.5% incidents where reported in the morning and 74.5% in the evening. The most fires (17.2%) took place on Tuesday, and the least (9.5%) on Saturday.
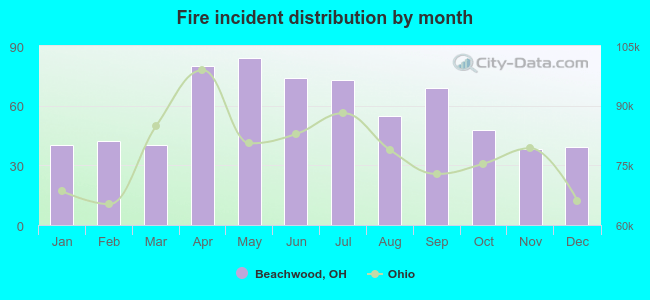 According to the 682 reports from years 2002 - 2018 most fires (12.3%) took place during May, and the least (5.6%) in November.
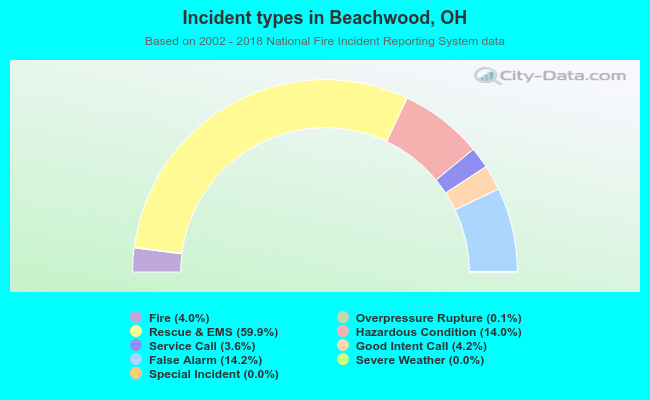 Out of all 16,921 cases reported during the years 2002 - 2018, the most belonged to the categories: Rescue & EMS (59.9%), False Alarm (14.2%), and Hazardous Condition (14.0%).
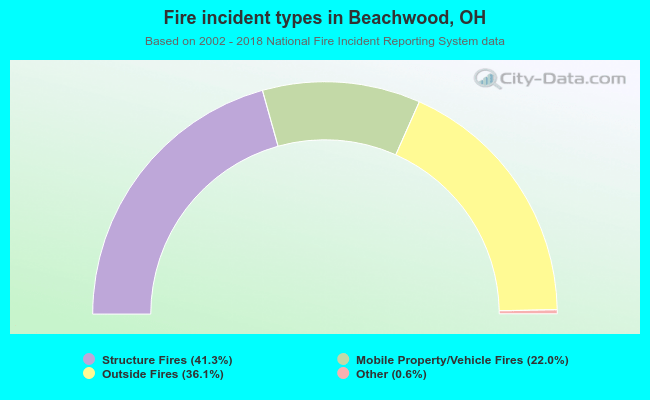 When looking into fire subcategories, the most incidents belonged to: Structure Fires (41.3%), and Outside Fires (36.1%).