Beallsville: Fire Incidents, Ohio (OH)
Where are fire incidents reported in Beallsville, OH
Something went wrong! Please refresh the page.
|
| |||||||||||||||||||||||||||||||||||||||||||||||||||||||||
| Other | 42 | |||||||||||||||||||||||||||||||||||||||||||||||||||||||||
2002 - 2018 National Fire Incident Reporting System (NFIRS) incidents
- Incident types reported to NFIRS in Beallsville, OH
- 12845.7%Rescue & EMS
- 11240.0%Fire
- 165.7%Good Intent Call
- 113.9%Hazardous Condition
- 51.8%Service Call
- 41.4%False Alarm
- 31.1%Overpressure Rupture
- 10.4%Severe Weather
- Fire incident types reported to NFIRS in Beallsville, OH
- 6255.4%Structure Fires
- 3430.4%Outside Fires
- 1412.5%Mobile Property/Vehicle Fires
- 21.8%Other
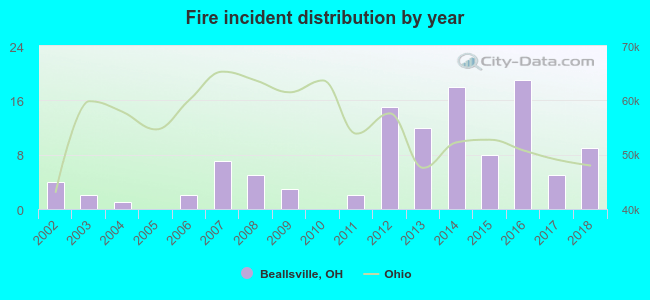 Based on the data from the years 2002 - 2018 the average number of fires per year is 7. The highest number of reported fires - 19 took place in 2016, and the least - 0 in 2005. The data has a rising trend.
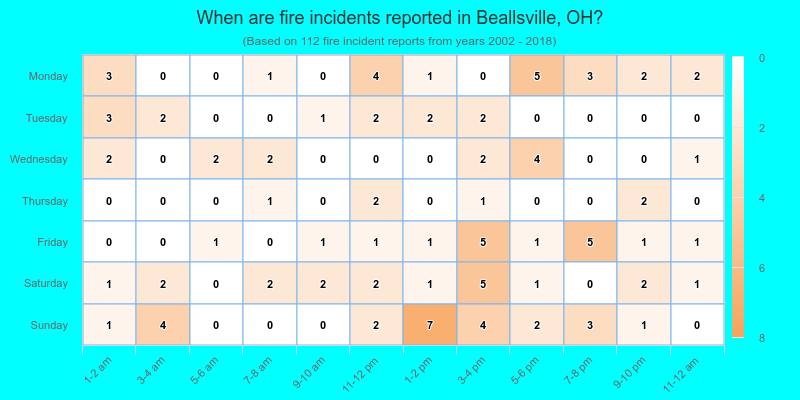
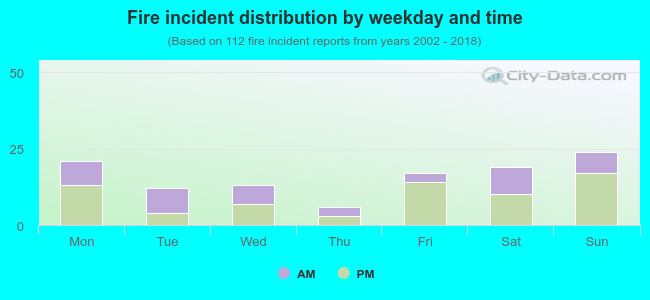 39.3% incidents where reported in the morning and 60.7% in the evening. The most fires (21.4%) took place on Sunday, and the least (5.4%) on Thursday.
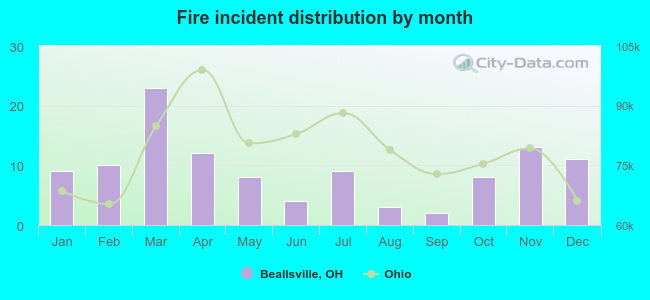 According to the 112 reports from years 2002 - 2018 most fires (20.5%) took place during March, and the least (1.8%) in September.
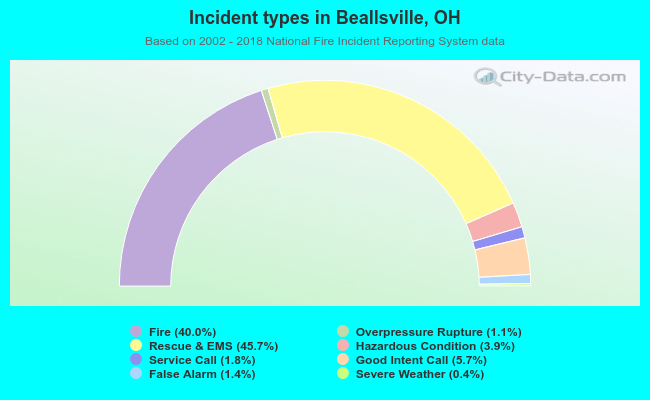 Out of all 280 cases reported during the years 2002 - 2018, the most belonged to the categories: Rescue & EMS (45.7%), Fire (40.0%), and Good Intent Call (5.7%).
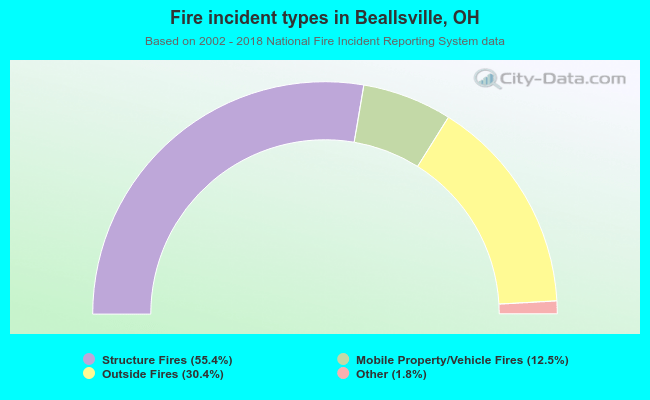 When looking into fire subcategories, the most reports belonged to: Structure Fires (55.4%), and Outside Fires (30.4%).