Belmont: Fire Incidents, North Carolina (NC)
Where are fire incidents reported in Belmont, NC
Something went wrong! Please refresh the page.
|
| |||||||||||||||||||||||||||||||||||||||||||||||||||||||||||||||||||||||||||||||||||||||||||||||||||||||||||||
2002 - 2018 National Fire Incident Reporting System (NFIRS) incidents
- Incident types reported to NFIRS in Belmont, NC
- 2,62737.1%Rescue & EMS
- 1,18616.8%Good Intent Call
- 1,02414.5%Service Call
- 81711.5%Hazardous Condition
- 7009.9%False Alarm
- 6629.4%Fire
- 430.6%Severe Weather
- 100.1%Special Incident
- Fire incident types reported to NFIRS in Belmont, NC
- 26139.4%Structure Fires
- 23235.0%Outside Fires
- 14822.4%Mobile Property/Vehicle Fires
- 213.2%Other
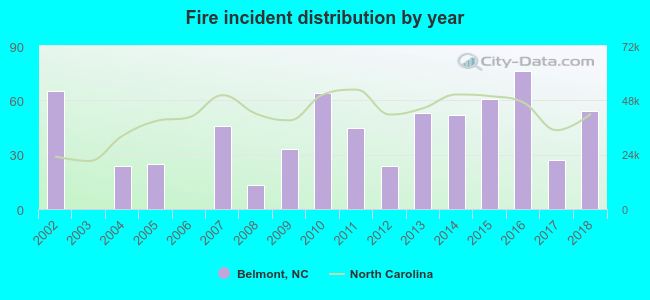 According to the data from the years 2002 - 2018 the average number of fire incidents per year is 39. The highest number of fire incidents - 76 took place in 2016, and the least - 0 in 2003. The data has a decreasing trend.
The average number of yearly fire incidents per 10k residents in Belmont, NC compared to nearest cities:
(Note: Based on data for the last 3 years, including only cities with population 5,000 and above)
| Belmont: | 50.1 |
| Mount Holly: | 58.7 |
| Gastonia: | 18.4 |
| Charlotte: | 21.2 |
| Pineville: | 44.1 |
| Bessemer City: | 46.8 |
| Huntersville: | 7.4 |
| Kings Mountain: | 112.4 |
| Cornelius: | 14.8 |
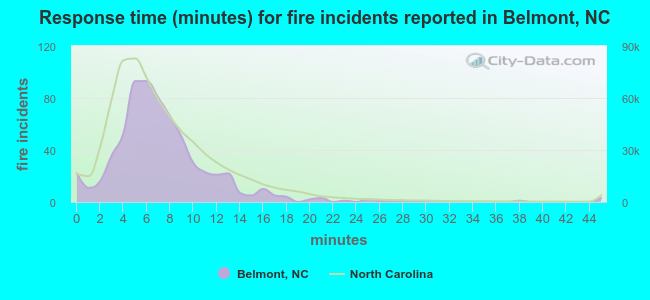 The median response time based on all reported fire incidents is 7 minutes. This is similar to the state median value.
The median response time in Belmont, NC compared to nearest cities:
(Note: Based on data for all years, including only cities with at least 500 fire incidents)
| Belmont: | 7 minutes |
| Mount Holly: | 7 minutes |
| Gastonia: | 6 minutes |
| Stanley: | 8 minutes |
| Dallas: | 8 minutes |
| Charlotte: | 5 minutes |
| Pineville: | 7 minutes |
| Huntersville: | 6 minutes |
| Kings Mountain: | 7 minutes |
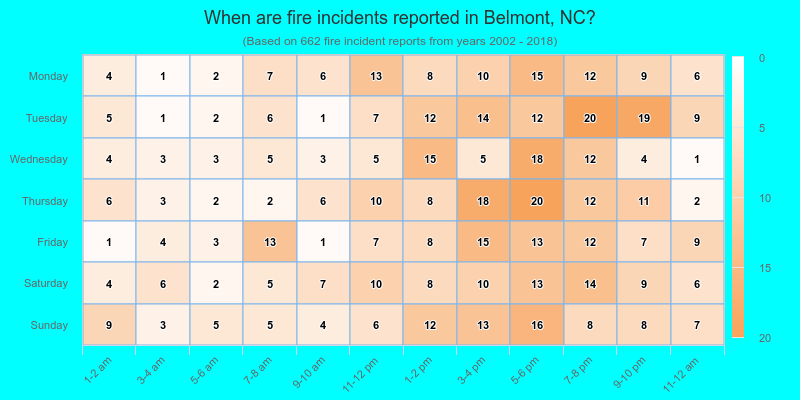
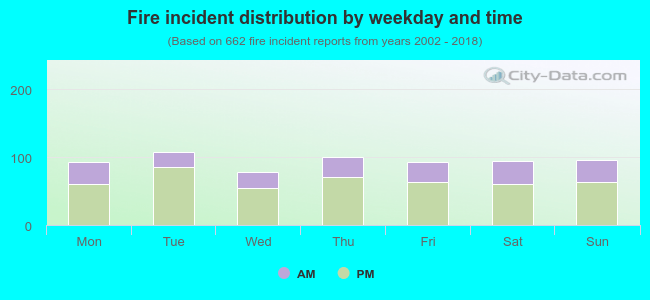 30.5% incidents where reported in the morning and 69.5% in the evening. The most fires (16.3%) took place on Tuesday, and the least (11.8%) on Wednesday.
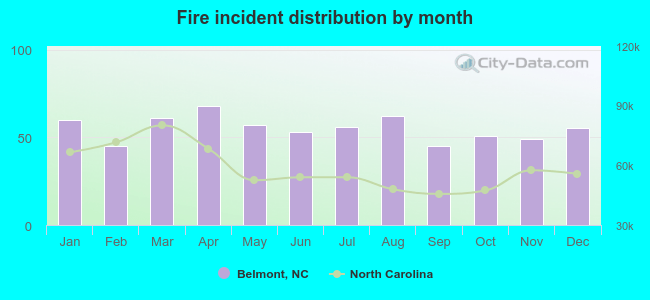 Based on the 662 fire incident reports from years 2002 - 2018 most fires (10.3%) took place during April, and the least (6.8%) in February.
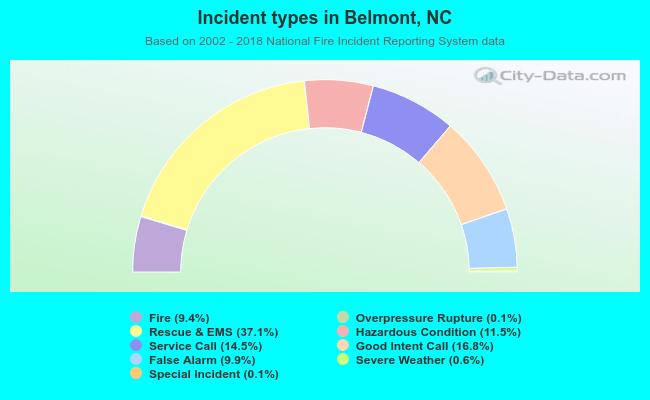 Out of all 7,076 cases reported during the years 2002 - 2018, the most belonged to the categories: Rescue & EMS (37.1%), Good Intent Call (16.8%), and Service Call (14.5%).
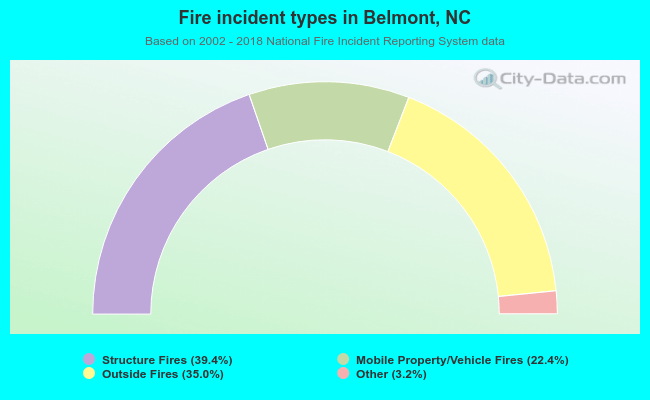 When looking into fire subcategories, the most reports belonged to: Structure Fires (39.4%), and Outside Fires (35.0%).