Bend: Fire Incidents, Oregon (OR)
Where are fire incidents reported in Bend, OR
Something went wrong! Please refresh the page.
| Fire incidents reported | |
|---|---|
| Sreet name | Count |
| 3RD ST | 272 |
| HWY 97 | 256 |
| HWY 20 | 172 |
| 27TH ST | 112 |
| CENTURY DR | 106 |
| BUTLER MARKET RD | 98 |
| BEAR CREEK RD | 94 |
| 15TH ST | 82 |
| GREENWOOD AVE | 82 |
| HWY 97 HWY | 80 |
| 4TH ST | 76 |
| WALL ST | 74 |
| FRANKLIN AVE | 70 |
| HWY 20 HWY | 66 |
| BROSTERHOUS RD | 64 |
| REED MARKET RD | 62 |
| 2ND ST | 58 |
| BOND ST | 58 |
| DESCHUTES MARKET RD | 56 |
| NEWPORT AVE | 56 |
| 6TH ST | 54 |
| BAKER RD | 54 |
| BELLEVUE DR | 54 |
| HAWTHORNE AVE | 52 |
| GERKING MARKET RD | 50 |
| LM | 48 |
| PURCELL BLVD | 48 |
| NEFF RD | 44 |
| BOYD ACRES RD | 42 |
| OB RILEY RD | 42 |
| Other | 2,427 |
2002 - 2018 National Fire Incident Reporting System (NFIRS) incidents
- Incident types reported to NFIRS in Bend, OR
- 26,32465.6%Rescue & EMS
- 4,90912.2%Fire
- 3,6039.0%Good Intent Call
- 2,5146.3%Service Call
- 1,4003.5%False Alarm
- 1,3653.4%Hazardous Condition
- Fire incident types reported to NFIRS in Bend, OR
- 2,73255.7%Outside Fires
- 1,46529.8%Structure Fires
- 59412.1%Mobile Property/Vehicle Fires
- 1182.4%Other
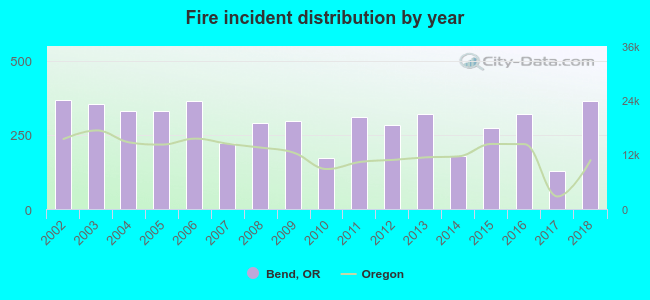 According to the data from the years 2002 - 2018 the average number of fire incidents per year is 289. The highest number of fires - 367 took place in 2002, and the least - 128 in 2017. The data has a dropping trend.
The average number of yearly fire incidents per 10k residents in Bend, OR compared to nearest cities:
(Note: Based on data for the last 3 years, including only cities with population 5,000 and above)
| Bend: | 32.3 |
| Tumalo: | 1.4 |
| Redmond: | 28.9 |
| Prineville: | 60.1 |
| Madras: | 71.9 |
| Sweet Home: | 30.3 |
| Pleasant Hill: | 45.9 |
| Springfield: | 18.4 |
| Lebanon: | 31.7 |
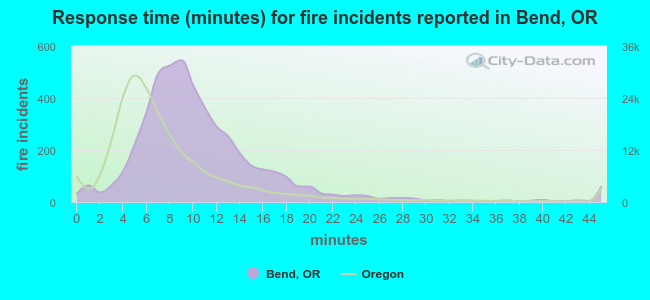 The median response time based on all reported fire incidents is 9 minutes. This is higher than the Oregon median value.
The median response time in Bend, OR compared to nearest cities:
(Note: Based on data for all years, including only cities with at least 500 fire incidents)
| Bend: | 9 minutes |
| Redmond: | 8 minutes |
| Sisters: | 9 minutes |
| La Pine: | 12 minutes |
| Prineville: | 9 minutes |
| Madras: | 8 minutes |
| Sweet Home: | 7 minutes |
| Springfield: | 5 minutes |
| Lebanon: | 6 minutes |
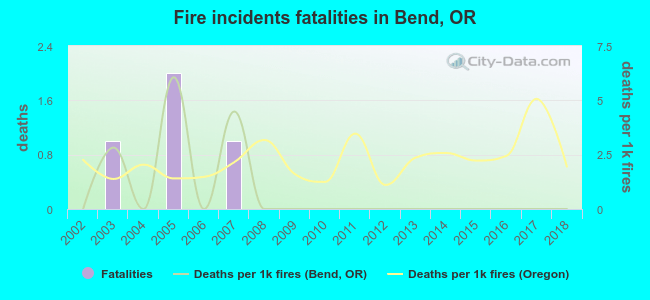 Based on the data from the years 2002 - 2018 the average number of fire-related yearly deaths is 0. The highest number of reported deaths - 2 took place in 2005, and the lowest - 0 in 2002. The data has a constant trend.
The average number of fatalities per 1,000 fire incidents is 1. This indicator was the highest - 6 in 2005, and the lowest 0 in 2002. The trend for fatalities per 1,000 incidents is constant. Compared to the Oregon value the number of deaths per 1,000 fire incidents is much lower.
Based on the data from the years 2002 - 2018 the average number of fire-related yearly deaths is 0. The highest number of reported deaths - 2 took place in 2005, and the lowest - 0 in 2002. The data has a constant trend.
The average number of fatalities per 1,000 fire incidents is 1. This indicator was the highest - 6 in 2005, and the lowest 0 in 2002. The trend for fatalities per 1,000 incidents is constant. Compared to the Oregon value the number of deaths per 1,000 fire incidents is much lower.Deaths per 1,000 incidents in Bend, OR compared to nearest cities:
(Note: Based on data for all years, including only cities with at least 2,500 fire incidents)
| Bend: | 0.8 |
| Springfield: | 2.1 |
| Eugene: | 1.6 |
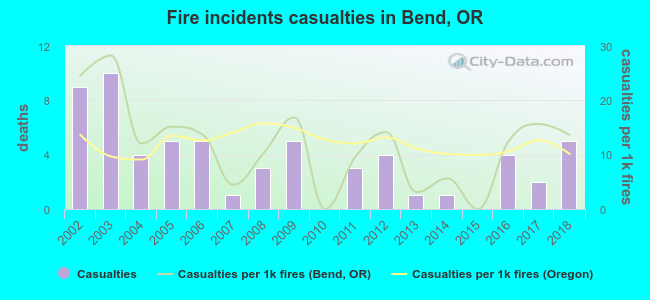 Based on the reports from the years 2002 - 2018 the average number of fire-related yearly casualties is 4. The highest number of casualties - 10 took place in 2003, and the lowest - 0 in 2010. The data has a dropping trend.
The average number of casualties per 1,000 fires is 12. This indicator was the highest - 28 in 2003, and the lowest 0 in 2010. The trend for casualties per 1,000 incidents is declining. Compared to the state value the number of casualties per 1,000 incidents is similar.
Based on the reports from the years 2002 - 2018 the average number of fire-related yearly casualties is 4. The highest number of casualties - 10 took place in 2003, and the lowest - 0 in 2010. The data has a dropping trend.
The average number of casualties per 1,000 fires is 12. This indicator was the highest - 28 in 2003, and the lowest 0 in 2010. The trend for casualties per 1,000 incidents is declining. Compared to the state value the number of casualties per 1,000 incidents is similar.Casualties per 1,000 incidents in Bend, OR compared to nearest cities:
(Note: Based on data for all years, including only cities with at least 500 fire incidents)
| Bend: | 12.6 |
| Redmond: | 4.6 |
| Sisters: | 1.2 |
| La Pine: | 8.3 |
| Prineville: | 9.2 |
| Madras: | 4.3 |
| Sweet Home: | 20.6 |
| Springfield: | 22.3 |
| Lebanon: | 24.2 |
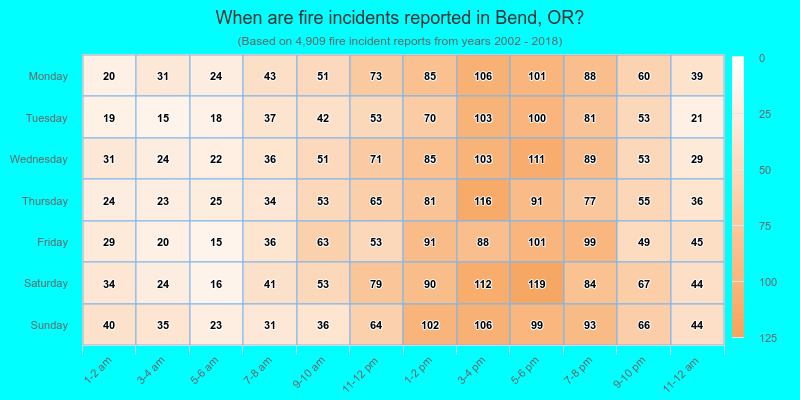
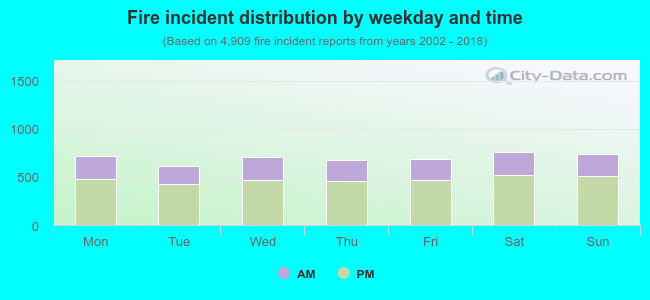 32.1% incidents where reported in the morning and 67.9% in the evening. The most fires (15.5%) took place on Saturday, and the least (12.5%) on Tuesday.
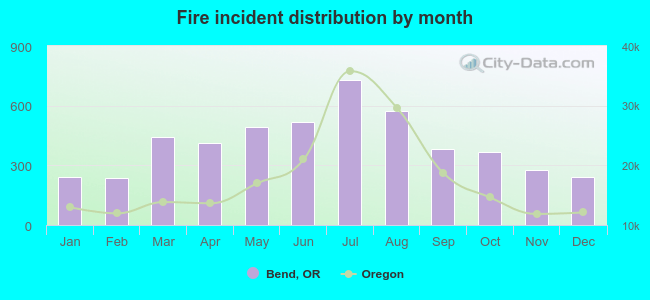 Based on the 4,909 incident reports from years 2002 - 2018 most fires (14.8%) took place during July, and the least (4.8%) in February.
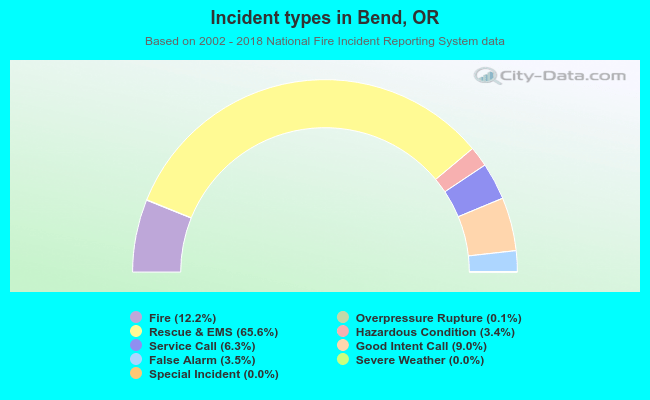 Out of all 40,158 cases reported during the years 2002 - 2018, the most belonged to the categories: Rescue & EMS (65.6%), Fire (12.2%), and Good Intent Call (9.0%).
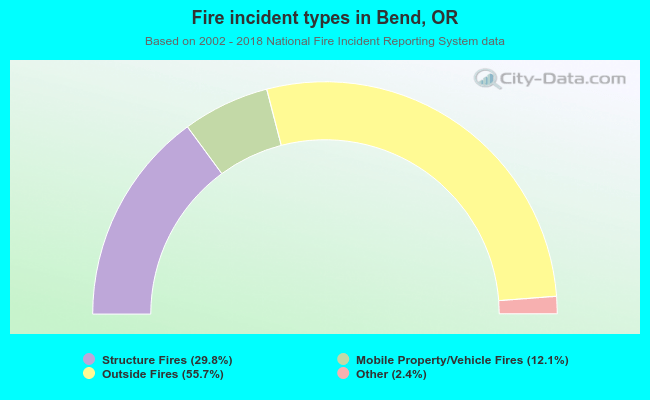 When looking into fire subcategories, the most reports belonged to: Outside Fires (55.7%), and Structure Fires (29.8%).