Berkeley: Fire Incidents, Illinois (IL)
Where are fire incidents reported in Berkeley, IL
Something went wrong! Please refresh the page.
| Fire incidents reported | |
|---|---|
| Sreet name | Count |
| ST CHARLES RD | 340 |
| ARTHUR | 198 |
| TAFT AVE | 134 |
| BUTTERFIELD RD | 86 |
| SPENCER | 32 |
| BOHLANDER | 24 |
| MAPLE | 22 |
| CALVIN | 20 |
| HERBERT | 18 |
| RIDGE AVE | 18 |
| ATWOOD | 16 |
| BIRCH | 14 |
| JERELE AVE | 14 |
| LEE BLVD | 14 |
| SPEECHLEY | 14 |
| ST. CHARLES RD | 14 |
| ARTHUR AVE | 12 |
| BUTTERFIELD RD. | 12 |
| KOUBA DR | 12 |
| MC DERMOTT DR | 12 |
| MORRIS | 12 |
| WOLF RD | 12 |
| MURRAY DR | 10 |
| PARK | 10 |
| PROSPECT | 10 |
| ST CHARLES | 10 |
| ST CHARLES ROAD | 10 |
| ST. CHARLES RD. | 10 |
| ARTHUR AVE. | 8 |
| ELM | 8 |
2002 - 2018 National Fire Incident Reporting System (NFIRS) incidents
- Incident types reported to NFIRS in Berkeley, IL
- 2,29043.2%Rescue & EMS
- 82815.6%Good Intent Call
- 79915.1%Fire
- 59111.1%Hazardous Condition
- 58111.0%False Alarm
- 2104.0%Service Call
- Fire incident types reported to NFIRS in Berkeley, IL
- 60575.7%Structure Fires
- 11214.0%Mobile Property/Vehicle Fires
- 536.6%Outside Fires
- 293.6%Other
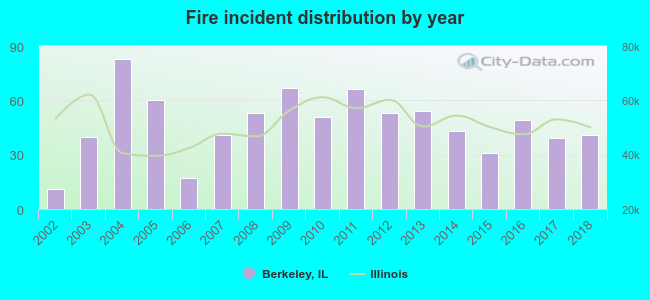 Based on the data from the years 2002 - 2018 the average number of fire incidents per year is 47. The highest number of reported fire incidents - 83 took place in 2004, and the least - 11 in 2002. The data has an increasing trend.
The average number of yearly fire incidents per 10k residents in Berkeley, IL compared to nearest cities:
(Note: Based on data for the last 3 years, including only cities with population 5,000 and above)
| Berkeley: | 82.2 |
| Hillside: | 67.1 |
| Elmhurst: | 18.9 |
| Bellwood: | 43.3 |
| Northlake: | 33.7 |
| Westchester: | 37.1 |
| Melrose Park: | 35.1 |
| Broadview: | 57.0 |
| Villa Park: | 40.8 |
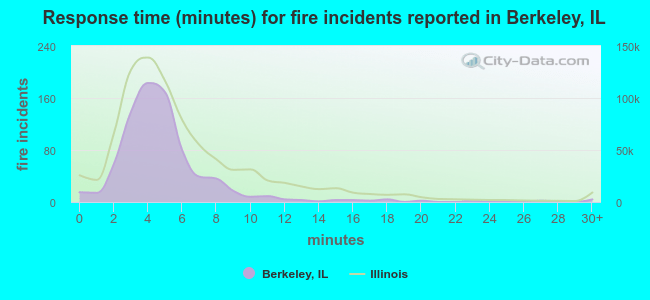 The median response time based on all reported fire incidents is 4 minutes. This is lower than the Illinois median value.
The median response time in Berkeley, IL compared to nearest cities:
(Note: Based on data for all years, including only cities with at least 500 fire incidents)
| Berkeley: | 4 minutes |
| Hillside: | 4 minutes |
| Elmhurst: | 5 minutes |
| Bellwood: | 3 minutes |
| Northlake: | 5 minutes |
| Westchester: | 4 minutes |
| Melrose Park: | 4 minutes |
| Broadview: | 3 minutes |
| Villa Park: | 4 minutes |
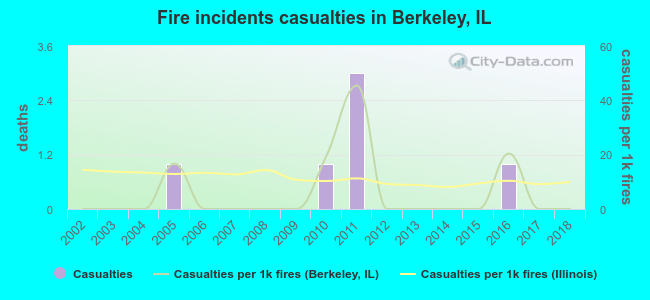 Based on the reports from the years 2002 - 2018 the average number of fire-related yearly casualties is 0. The highest number of reported casualties - 3 took place in 2011, and the lowest - 0 in 2002. The data has a constant trend.
The average number of injuries per 1,000 fires is 6. This indicator was the highest - 45 in 2011, and the lowest 0 in 2002. The trend for injuries per 1,000 incidents is constant. Compared to the state value the number of injuries per 1,000 fire incidents is lower.
Based on the reports from the years 2002 - 2018 the average number of fire-related yearly casualties is 0. The highest number of reported casualties - 3 took place in 2011, and the lowest - 0 in 2002. The data has a constant trend.
The average number of injuries per 1,000 fires is 6. This indicator was the highest - 45 in 2011, and the lowest 0 in 2002. The trend for injuries per 1,000 incidents is constant. Compared to the state value the number of injuries per 1,000 fire incidents is lower.Casualties per 1,000 incidents in Berkeley, IL compared to nearest cities:
(Note: Based on data for all years, including only cities with at least 500 fire incidents)
| Berkeley: | 7.5 |
| Hillside: | 17.0 |
| Elmhurst: | 9.7 |
| Bellwood: | 5.1 |
| Northlake: | 4.7 |
| Westchester: | 15.6 |
| Melrose Park: | 12.3 |
| Broadview: | 17.9 |
| Villa Park: | 25.6 |
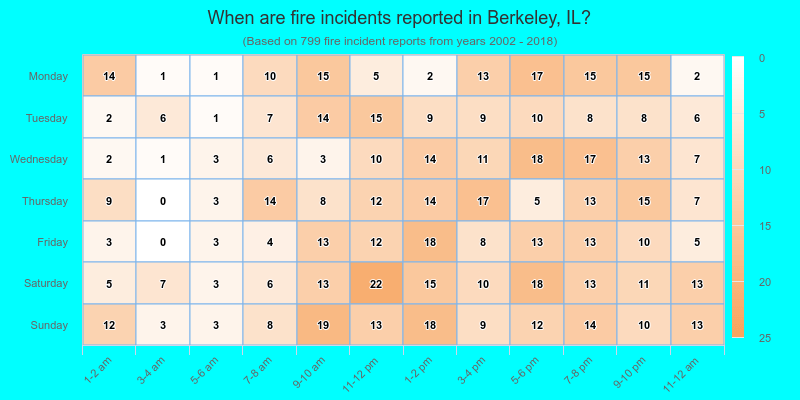
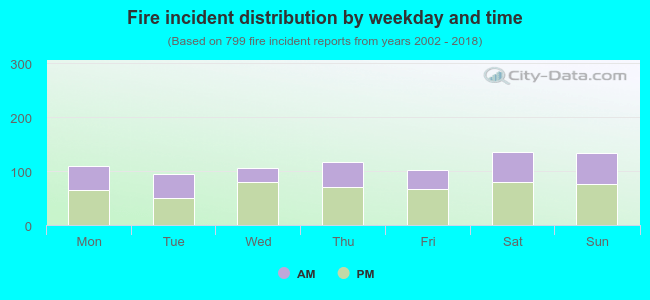 38.9% incidents where reported in the morning and 61.1% in the evening. The most fires (17.0%) took place on Saturday, and the least (11.9%) on Tuesday.
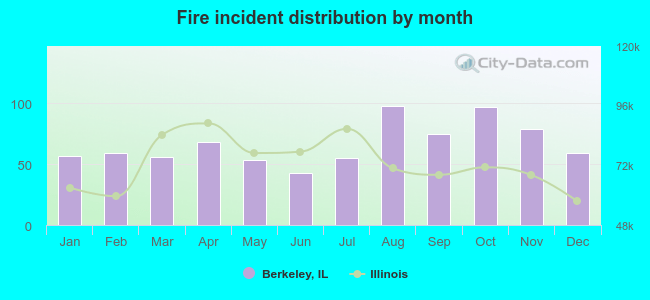 According to the 799 fire incident reports from years 2002 - 2018 most fires (12.3%) took place during August, and the least (5.4%) in June.
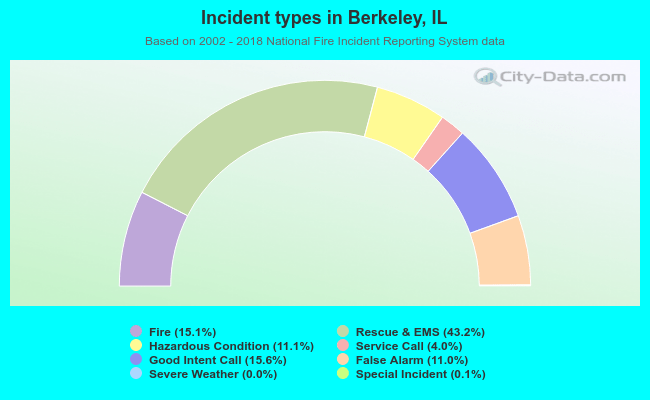 Out of all 5,305 cases reported during the years 2002 - 2018, the most belonged to the categories: Overpressure Rupture (43.2%), Service Call (15.6%), and Fire (15.1%).
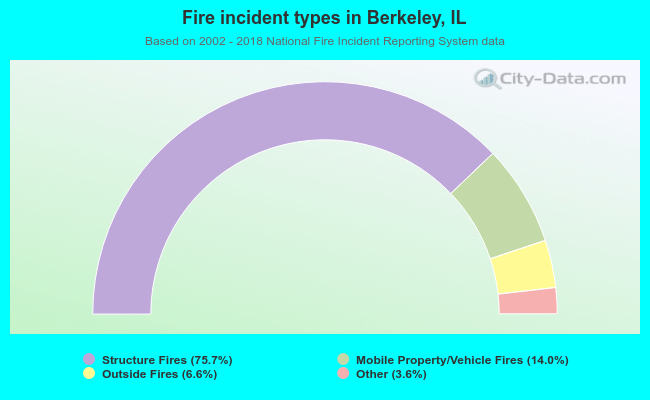 When looking into fire subcategories, the most incidents belonged to: Structure Fires (75.7%), and Mobile Property/Vehicle Fires (14.0%).