Bethany: Fire Incidents, Connecticut (CT)
Where are fire incidents reported in Bethany, CT
Something went wrong! Please refresh the page.
|
| |||||||||||||||||||||||||||||||||||||||||||||||||||||||||||||||||||||||||||||||||||||||||||||||||||||||||||||
2002 - 2018 National Fire Incident Reporting System (NFIRS) incidents
- Incident types reported to NFIRS in Bethany, CT
- 1,90659.4%Rescue & EMS
- 42313.2%False Alarm
- 41512.9%Hazardous Condition
- 2106.5%Service Call
- 1695.3%Fire
- 772.4%Good Intent Call
- 70.2%Special Incident
- Fire incident types reported to NFIRS in Bethany, CT
- 6840.2%Outside Fires
- 6538.5%Structure Fires
- 2615.4%Mobile Property/Vehicle Fires
- 105.9%Other
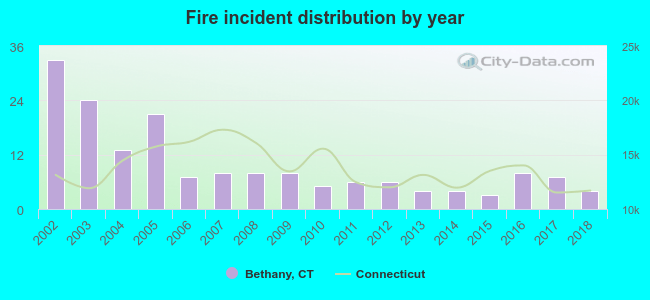 Based on the data from the years 2002 - 2018 the average number of fire incidents per year is 10. The highest number of reported fire incidents - 33 took place in 2002, and the least - 3 in 2015. The data has a decreasing trend.
The average number of yearly fire incidents per 10k residents in Bethany, CT compared to nearest cities:
(Note: Based on data for the last 3 years, including only cities with population 5,000 and above)
| Bethany: | 11.4 |
| Beacon Falls: | 40.8 |
| Seymour: | 29.4 |
| Woodbridge: | 51.2 |
| Hamden: | 29.3 |
| Naugatuck: | 31.4 |
| Prospect: | 14.9 |
| Ansonia: | 49.2 |
| Oxford: | 26.3 |
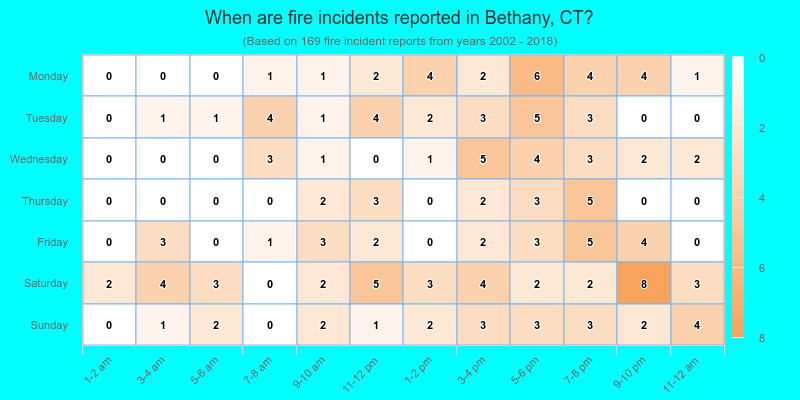
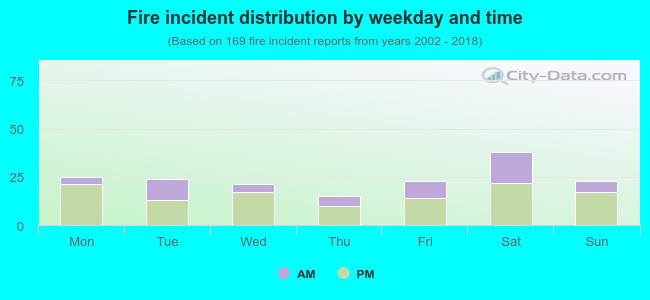 32.5% incidents where reported in the morning and 67.5% in the evening. The most fires (22.5%) took place on Saturday, and the least (8.9%) on Thursday.
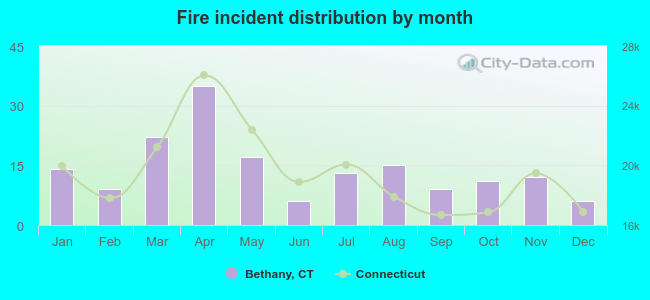 According to the 169 reports from years 2002 - 2018 most fires (20.7%) took place during April, and the least (3.6%) in June.
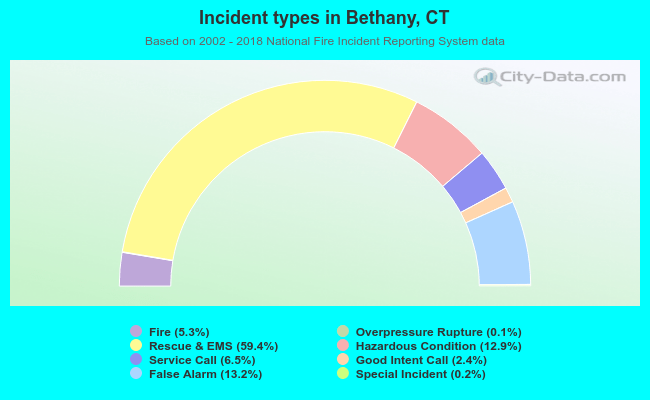 Out of all 3,209 cases reported during the years 2002 - 2018, the most belonged to the categories: Rescue & EMS (59.4%), False Alarm (13.2%), and Hazardous Condition (12.9%).
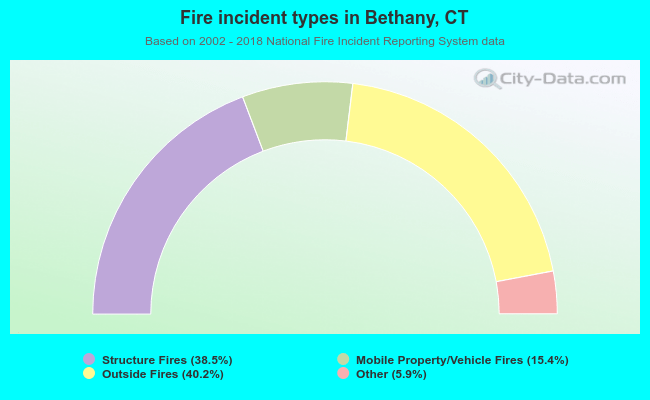 When looking into fire subcategories, the most incidents belonged to: Outside Fires (40.2%), and Structure Fires (38.5%).