Big Stone Gap: Fire Incidents, Virginia (VA)
Where are fire incidents reported in Big Stone Gap, VA
Something went wrong! Please refresh the page.
|
| |||||||||||||||||||||||||||||||||||||||||||||||||||||||||||||||||||||||||||||||||||||||||||||||||||||||||||||
| Other | 52 | |||||||||||||||||||||||||||||||||||||||||||||||||||||||||||||||||||||||||||||||||||||||||||||||||||||||||||||
2004 - 2018 National Fire Incident Reporting System (NFIRS) incidents
- Incident types reported to NFIRS in Big Stone Gap, VA
- 64034.4%Rescue & EMS
- 60032.3%Fire
- 28515.3%Hazardous Condition
- 19310.4%Good Intent Call
- 1015.4%False Alarm
- 321.7%Service Call
- 40.2%Severe Weather
- 30.2%Overpressure Rupture
- Fire incident types reported to NFIRS in Big Stone Gap, VA
- 30951.5%Structure Fires
- 14524.2%Outside Fires
- 7813.0%Mobile Property/Vehicle Fires
- 6811.3%Other
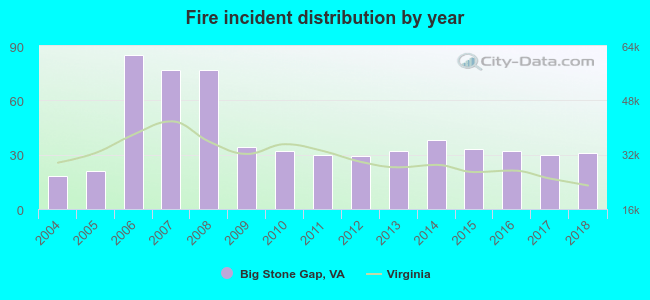 Based on the data from the years 2004 - 2018 the average number of fires per year is 40. The highest number of reported fires - 85 took place in 2006, and the least - 18 in 2004. The data has a growing trend.
The average number of yearly fire incidents per 10k residents in Big Stone Gap, VA compared to nearest cities:
(Note: Based on data for the last 3 years, including only cities with population 5,000 and above)
| Big Stone Gap: | 56.8 |
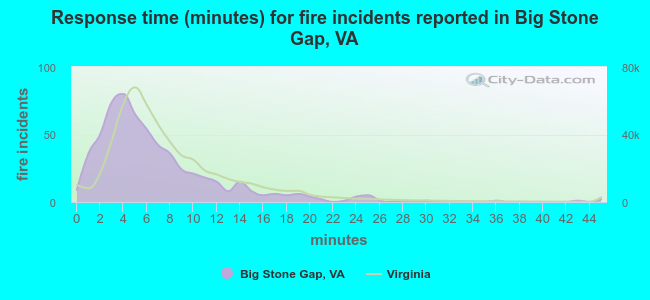 The median response time based on all reported fire incidents is 5 minutes. This is lower compared to the state median value.
The median response time in Big Stone Gap, VA compared to nearest cities:
(Note: Based on data for all years, including only cities with at least 500 fire incidents)
| Big Stone Gap: | 5 minutes |
| Gate City: | 10 minutes |
| Church Hill: | 9 minutes |
| Kingsport: | 7 minutes |
| Clintwood: | 19 minutes |
| Rogersville: | 10 minutes |
| Blountville: | 11 minutes |
| Gray: | 10 minutes |
| Hazard: | 6 minutes |
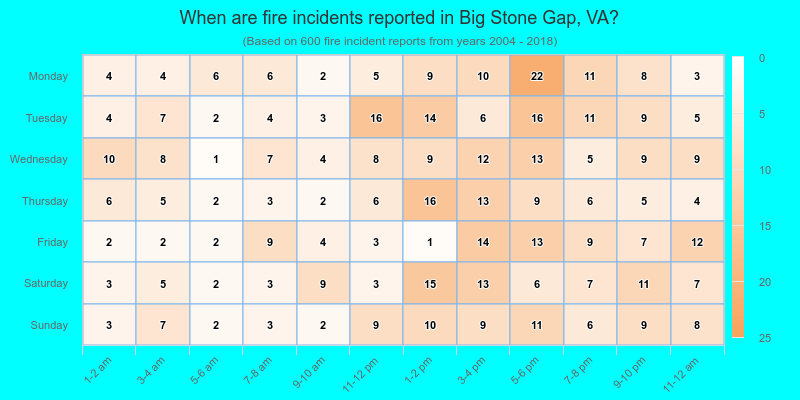
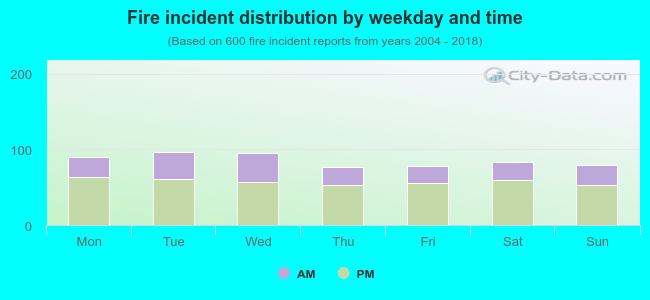 33.0% incidents where reported in the morning and 67.0% in the evening. The most fires (16.2%) took place on Tuesday, and the least (12.8%) on Thursday.
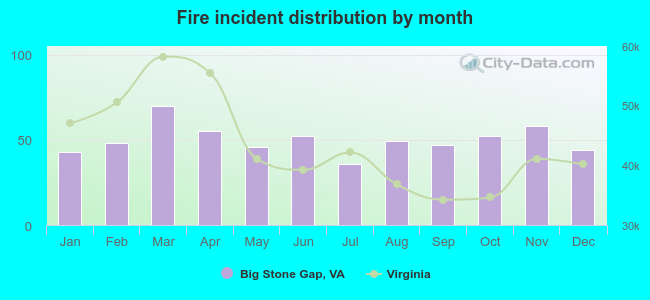 According to the 600 fires from years 2004 - 2018 most fires (11.7%) took place during March, and the least (6.0%) in July.
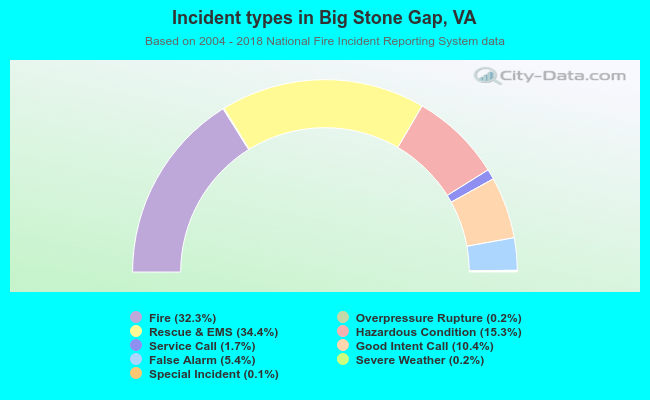 Out of all 1,859 cases reported during the years 2004 - 2018, the most belonged to the categories: Rescue & EMS (34.4%), Fire (32.3%), and Hazardous Condition (15.3%).
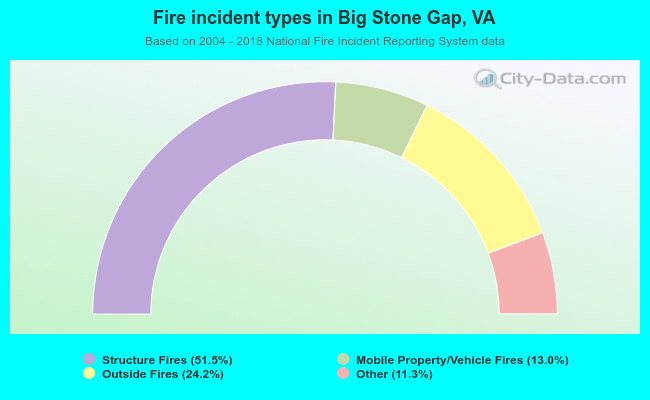 When looking into fire subcategories, the most incidents belonged to: Structure Fires (51.5%), and Outside Fires (24.2%).