Bloomfield: Fire Incidents, New York (NY)
Where are fire incidents reported in Bloomfield, NY
Something went wrong! Please refresh the page.
|
| |||||||||||||||||||||||||||||||||||||||||||||||||||||||||||||||||||||||||||||||||||||||||||||||||||||||||||||
2003 - 2018 National Fire Incident Reporting System (NFIRS) incidents
- Incident types reported to NFIRS in Bloomfield, NY
- 67434.2%Rescue & EMS
- 43422.0%Hazardous Condition
- 25813.1%Fire
- 22811.6%Service Call
- 1326.7%Good Intent Call
- 1266.4%False Alarm
- 1155.8%Severe Weather
- 40.2%Overpressure Rupture
- 20.1%Special Incident
- Fire incident types reported to NFIRS in Bloomfield, NY
- 12146.9%Structure Fires
- 7729.8%Outside Fires
- 4417.1%Mobile Property/Vehicle Fires
- 166.2%Other
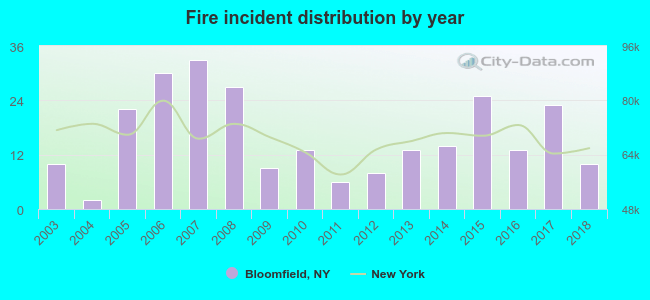 According to the data from the years 2003 - 2018 the average number of fires per year is 16. The highest number of reported fire incidents - 33 took place in 2007, and the least - 2 in 2004. The data has a constant trend.
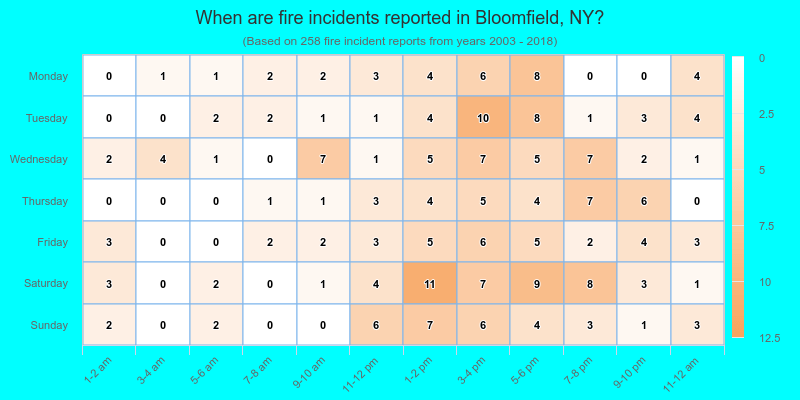
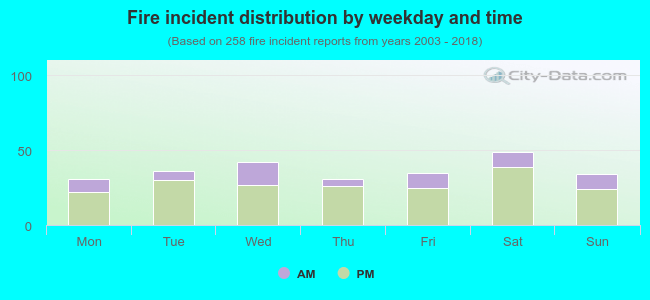 25.2% incidents where reported in the morning and 74.8% in the evening. The most fires (19.0%) took place on Saturday, and the least (12.0%) on Monday.
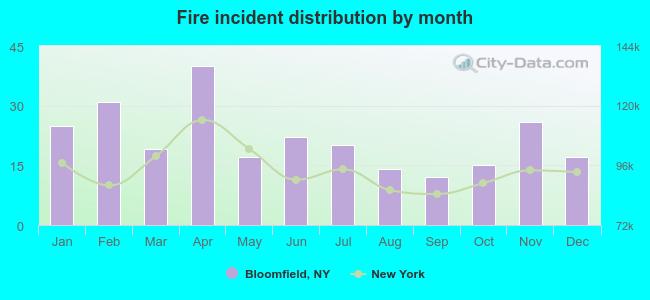 According to the 258 fires from years 2003 - 2018 most fires (15.5%) took place during April, and the least (4.7%) in September.
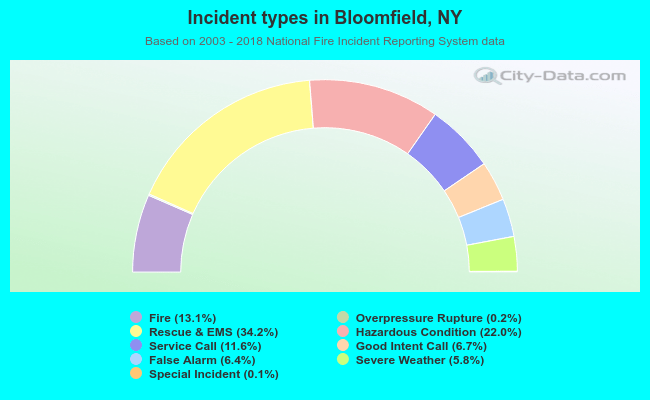 Out of all 1,973 cases reported during the years 2003 - 2018, the most belonged to the categories: Rescue & EMS (34.2%), Hazardous Condition (22.0%), and Fire (13.1%).
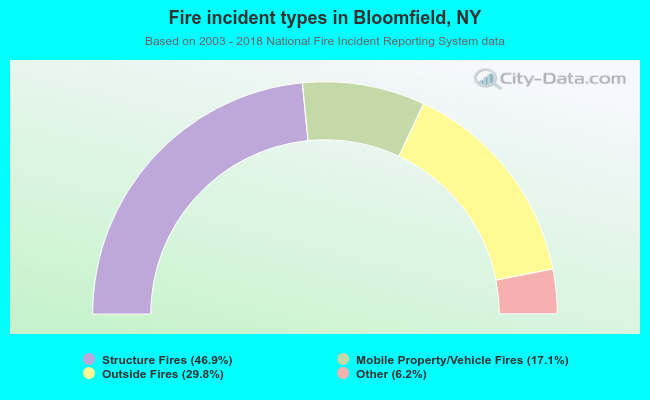 When looking into fire subcategories, the most incidents belonged to: Structure Fires (46.9%), and Outside Fires (29.8%).