| Fire incidents reported |
|---|
| Sreet name | Count |
|---|
| STATE HIGHWAY 86 | 34 | | AVERY RIDGE RD | 22 | | STATE HIGHWAY 13 | 20 | | STATE HIGHWAY JJ | 20 | | STATE HIGHWAY 86 HWY | 12 | | BROOKS SHADY DR | 10 | | HUSKEY DR | 10 | | MOSS RD | 10 | | STATE HIGHWAY 13 HWY | 10 | | STATE HIGHWAY EE | 10 | | STATE HIGHWAY EE HWY | 10 | | STATE HWY 13 | 10 | | STATE HWY EE | 10 | | STATE LINE RD | 10 | | COW CREEK RD | 6 | | DOC MILLER RD | 6 | | EVENING SIDE LN | 6 | | FINCH RD | 6 | | HALLIE DR | 6 | | STATE HIGHWAY JJ HWY | 6 | | STATE HWY 86 | 6 | | BLUEJAY RD | 4 | | BRUSH CREEK RD | 4 | | CARA LN | 4 | | FOSTER LN | 4 |
| | | Fire incidents reported |
|---|
| Sreet name | Count |
|---|
| HAMBY LN | 4 | | KIWIBIRD RD | 4 | | LONGSHORE DR | 4 | | MOORE LN | 4 | | ORIOLE LANE | 4 | | SHADY MAPLE RD | 4 | | SHORE POINT RD | 4 | | SISTERS RD | 4 | | STATE HIGHWAY UU | 4 | | STATE HWY JJ | 4 | | WOOD RIDGE DR | 4 | | YOUNGBLOOD DR | 4 | | 125 LAKECREAST DR | 2 | | 577 WOOD RIDGE RD | 2 | | ARUNDEL RD | 2 | | BARON TRAILS LN | 2 | | BLUE JAY LANE | 2 | | BOWMAN CHURCH LN | 2 | | BRANDONVILLE DR | 2 | | BREAD TRAY MOUNTAIN RD | 2 | | BRUCH CREEK RD | 2 | | BRUSH CREEK | 2 | | CAMBRIDGE DRIVE | 2 | | CEDAR DR | 2 | | |
|
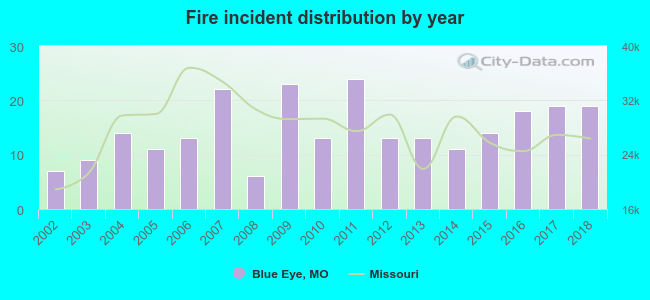 Based on the data from the years 2002 - 2018 the average number of fire incidents per year is 15. The highest number of fire incidents - 24 took place in 2011, and the least - 6 in 2008. The data has a rising trend.
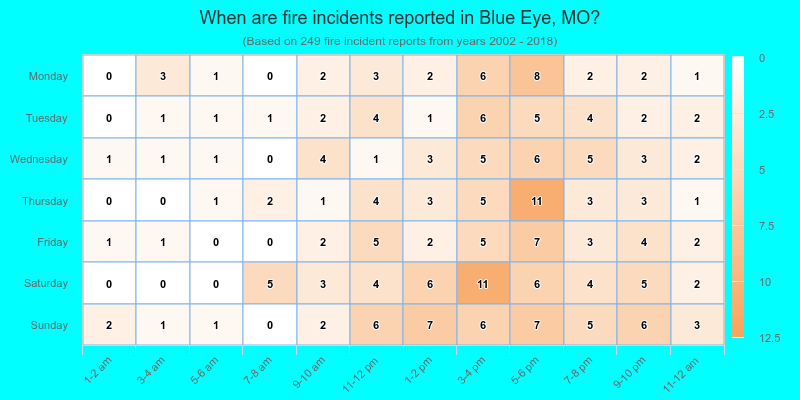
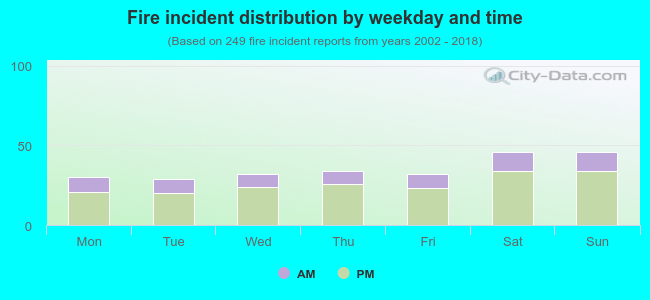 26.9% incidents where reported in the morning and 73.1% in the evening. The most fires (18.5%) took place on Saturday, and the least (11.6%) on Tuesday.
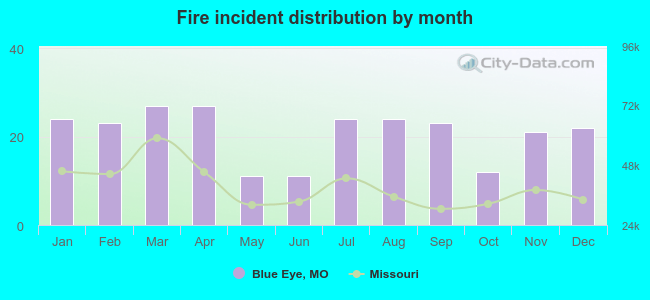 Based on the 249 incident reports from years 2002 - 2018 most fires (10.8%) took place during March, and the least (4.4%) in May.
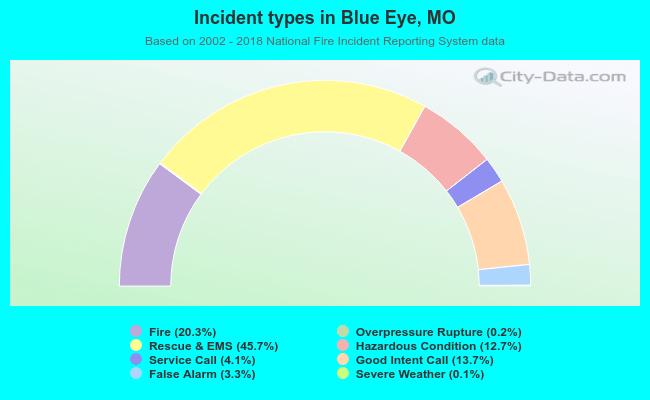 Out of all 1,227 cases reported during the years 2002 - 2018, the most belonged to the categories: Rescue & EMS (45.7%), Fire (20.3%), and Good Intent Call (13.7%).
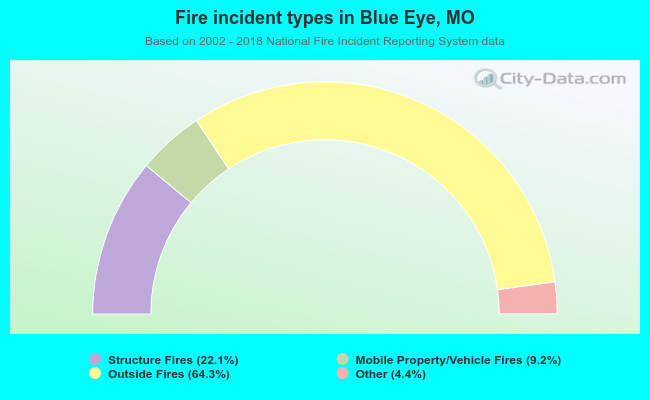 When looking into fire subcategories, the most incidents belonged to: Outside Fires (64.3%), and Structure Fires (22.1%).