Boardman: Fire Incidents, Ohio (OH)
Where are fire incidents reported in Boardman, OH
Something went wrong! Please refresh the page.
| Fire incidents reported | |
|---|---|
| Sreet name | Count |
| MARKET ST | 342 |
| SOUTH AVE | 202 |
| BOARDMAN CANFIELD RD | 190 |
| BOARDMAN POLAND RD | 160 |
| SOUTHERN BLVD | 160 |
| GLENWOOD AVE | 110 |
| WEST BLVD | 88 |
| SHIELDS RD | 58 |
| MATHEWS RD | 50 |
| LOCKWOOD BLVD | 44 |
| DORAL DR | 42 |
| MCCLURG RD | 40 |
| LEMANS DR | 38 |
| APPLECREST CT | 36 |
| WOLOSYN CIR | 36 |
| WESTERN RESERVE RD | 34 |
| I-680 | 30 |
| HITCHCOCK RD | 24 |
| INDIANOLA RD | 24 |
| BEECHWOOD DR | 22 |
| TIPPECANOE RD | 22 |
| ARAVESTA AVE | 20 |
| HILLMAN WAY | 20 |
| LAKE PARK RD | 20 |
| MIDLOTHIAN BLVD | 20 |
| SOUTH | 20 |
| ERSKINE AVE | 18 |
| MAPLE AVE | 18 |
| OAKRIDGE DR | 18 |
| WASHINGTON BLVD | 18 |
2004 - 2018 National Fire Incident Reporting System (NFIRS) incidents
- Incident types reported to NFIRS in Boardman, OH
- 2,73627.8%Rescue & EMS
- 2,10121.4%Hazardous Condition
- 1,57416.0%Fire
- 1,44014.6%False Alarm
- 98810.0%Service Call
- 9369.5%Good Intent Call
- 290.3%Overpressure Rupture
- 250.3%Severe Weather
- Fire incident types reported to NFIRS in Boardman, OH
- 75147.7%Structure Fires
- 53033.7%Outside Fires
- 28918.4%Mobile Property/Vehicle Fires
- 40.3%Other
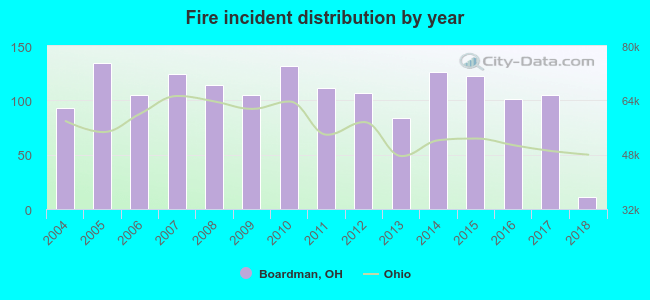 According to the data from the years 2004 - 2018 the average number of fires per year is 105. The highest number of fires - 134 took place in 2005, and the least - 11 in 2018. The data has a decreasing trend.
The average number of yearly fire incidents per 10k residents in Boardman, OH compared to nearest cities:
(Note: Based on data for the last 3 years, including only cities with population 5,000 and above)
| Boardman: | 20.4 |
| Struthers: | 33.2 |
| Youngstown: | 89.8 |
| Campbell: | 88.4 |
| Austintown: | 36.3 |
| Canfield: | 35.6 |
| Girard: | 36.9 |
| Hubbard: | 84.0 |
| Columbiana: | 40.0 |
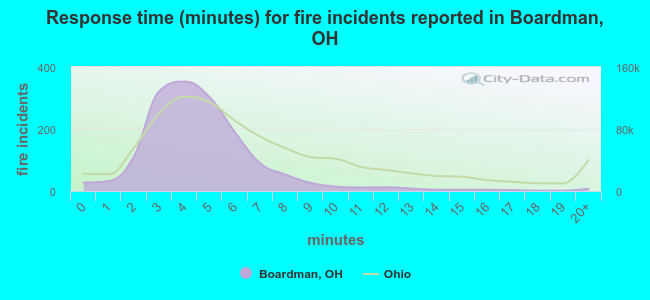 The median response time based on all reported fire incidents is 4 minutes. This is lower than the Ohio median value.
The median response time in Boardman, OH compared to nearest cities:
(Note: Based on data for all years, including only cities with at least 500 fire incidents)
| Boardman: | 4 minutes |
| Struthers: | 3 minutes |
| Youngstown: | 3 minutes |
| Campbell: | 3 minutes |
| Austintown: | 5 minutes |
| Canfield: | 6 minutes |
| Girard: | 4 minutes |
| Hubbard: | 8 minutes |
| Niles: | 4 minutes |
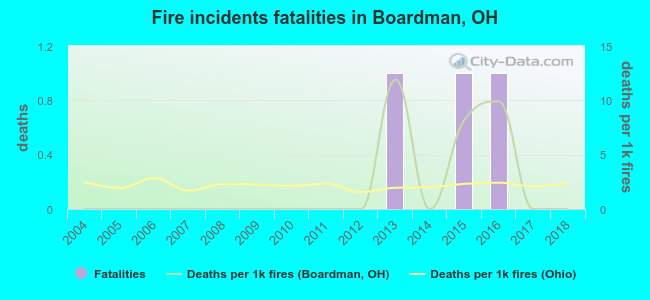 Based on the reports from the years 2004 - 2018 the average number of fire-related yearly deaths is 0. The highest number of reported deaths - 1 took place in 2013, and the lowest - 0 in 2004. The data has a constant trend.
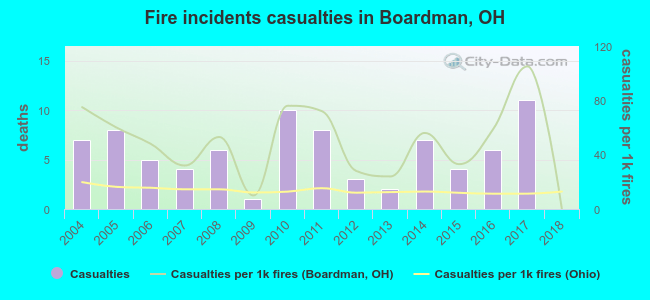 Based on the data from the years 2004 - 2018 the average number of fire-related yearly casualties is 5. The highest number of casualties - 11 took place in 2017, and the lowest - 0 in 2018. The data has a declining trend.
The average number of injuries per 1,000 fires is 49. This indicator was the highest - 105 in 2017, and the lowest 0 in 2018. The trend for injuries per 1,000 fires is declining. Compared to the state value the number of casualties per 1,000 fire incidents is much higher.
Based on the data from the years 2004 - 2018 the average number of fire-related yearly casualties is 5. The highest number of casualties - 11 took place in 2017, and the lowest - 0 in 2018. The data has a declining trend.
The average number of injuries per 1,000 fires is 49. This indicator was the highest - 105 in 2017, and the lowest 0 in 2018. The trend for injuries per 1,000 fires is declining. Compared to the state value the number of casualties per 1,000 fire incidents is much higher.Casualties per 1,000 incidents in Boardman, OH compared to nearest cities:
(Note: Based on data for all years, including only cities with at least 500 fire incidents)
| Boardman: | 52.1 |
| Struthers: | 21.8 |
| Youngstown: | 11.1 |
| Campbell: | 11.4 |
| Austintown: | 40.8 |
| Canfield: | 38.0 |
| Girard: | 5.8 |
| Hubbard: | 2.3 |
| Niles: | 17.0 |
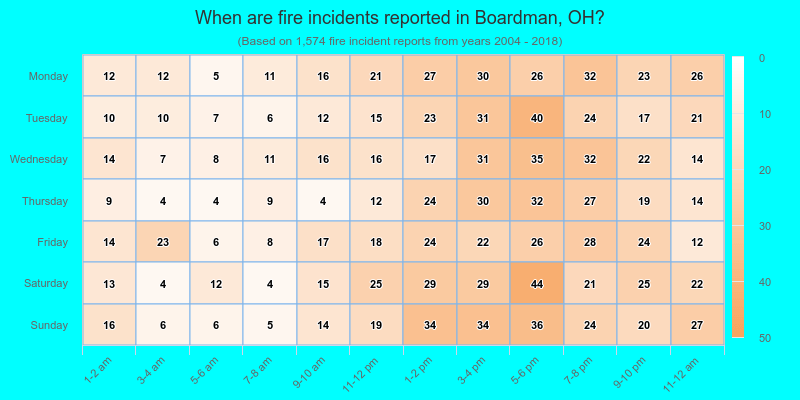
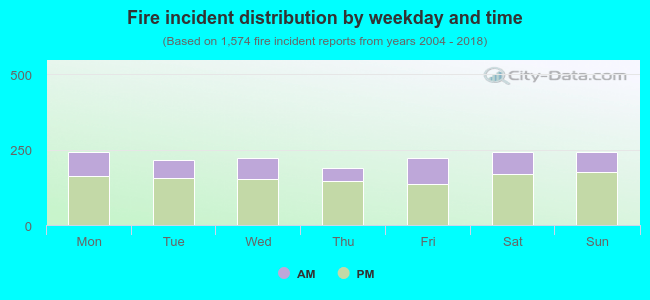 30.2% incidents where reported in the morning and 69.8% in the evening. The most fires (15.4%) took place on Saturday, and the least (11.9%) on Thursday.
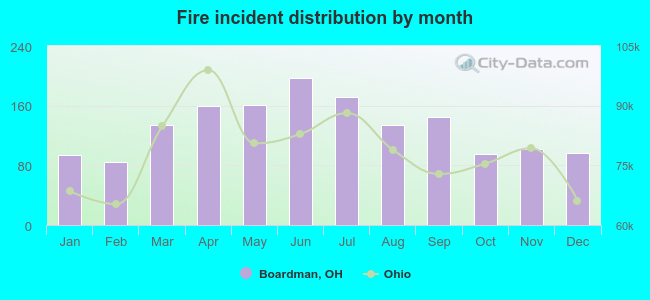 Based on the 1,574 reports from years 2004 - 2018 most fires (12.5%) took place during June, and the least (5.3%) in February.
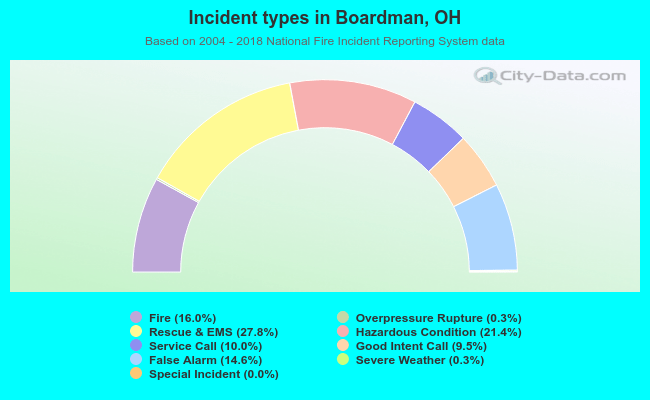 Out of all 9,833 cases reported during the years 2004 - 2018, the most belonged to the categories: Rescue & EMS (27.8%), Hazardous Condition (21.4%), and Fire (16.0%).
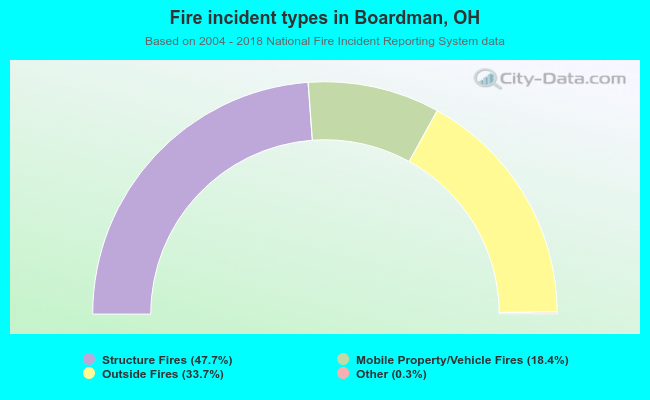 When looking into fire subcategories, the most incidents belonged to: Structure Fires (47.7%), and Outside Fires (33.7%).