Bodfish: Fire Incidents, California (CA)
Where are fire incidents reported in Bodfish, CA
Something went wrong! Please refresh the page.
|
| |||||||||||||||||||||||||||||||||||||||||||||||||||||||||||||||||||||||||||||||||||||||||||||||||||||||||||||
2005 - 2018 National Fire Incident Reporting System (NFIRS) incidents
- Incident types reported to NFIRS in Bodfish, CA
- 78464.4%Rescue & EMS
- 14211.7%Good Intent Call
- 1068.7%Fire
- 877.1%Hazardous Condition
- 594.8%Service Call
- 302.5%False Alarm
- 80.7%Special Incident
- Fire incident types reported to NFIRS in Bodfish, CA
- 5047.2%Structure Fires
- 4138.7%Outside Fires
- 1514.2%Mobile Property/Vehicle Fires
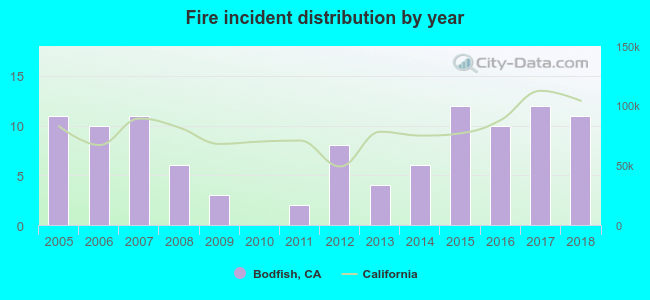 According to the data from the years 2005 - 2018 the average number of fires per year is 8. The highest number of reported fires - 12 took place in 2015, and the least - 0 in 2010. The data has a constant trend.
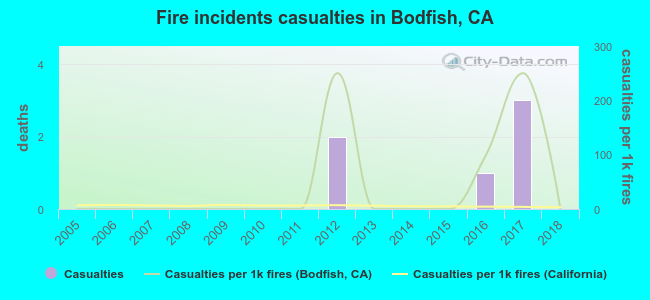 According to the data from the years 2005 - 2018 the average number of fire-related yearly casualties is 0. The highest number of injuries - 3 took place in 2017, and the lowest - 0 in 2005. The data has a constant trend.
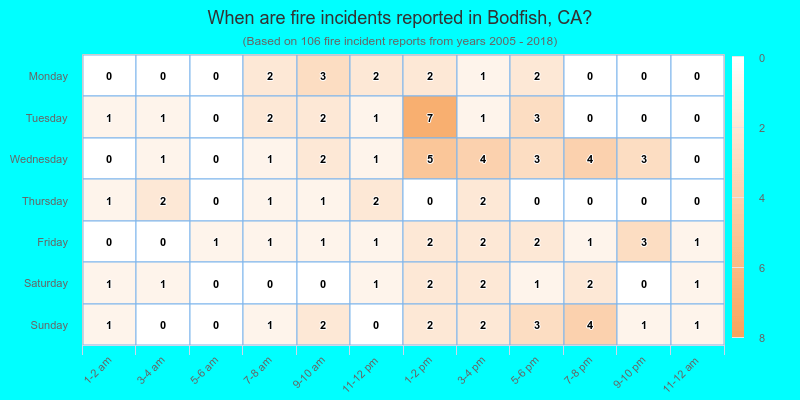
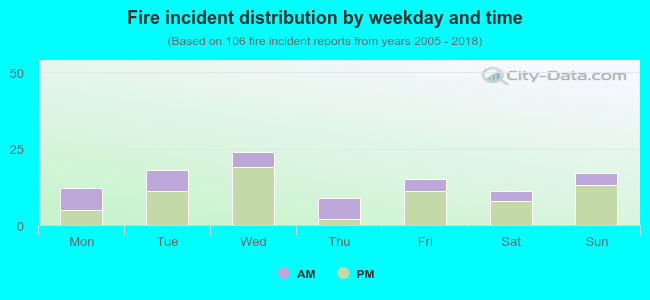 34.9% incidents where reported in the morning and 65.1% in the evening. The most fires (22.6%) took place on Wednesday, and the least (8.5%) on Thursday.
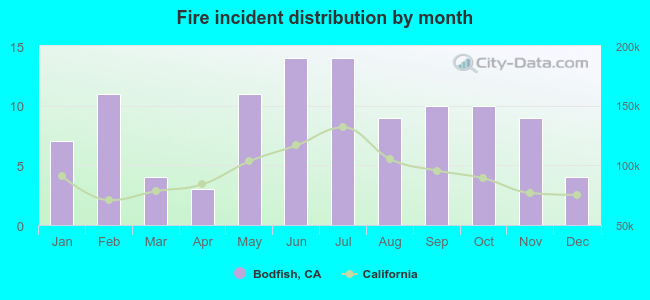 According to the 106 fires from years 2005 - 2018 most fires (13.2%) took place during June, and the least (2.8%) in April.
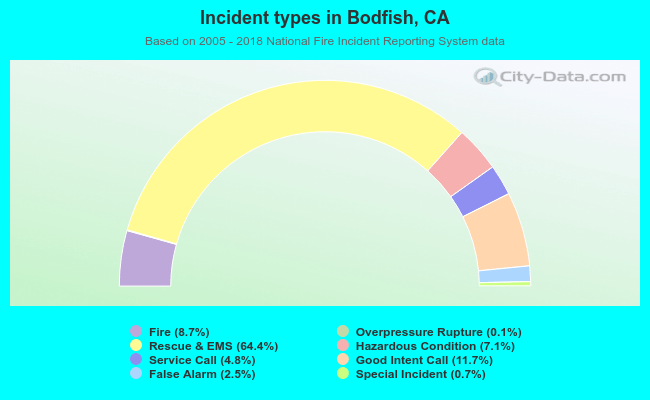 Out of all 1,217 cases reported during the years 2005 - 2018, the most belonged to the categories: Rescue & EMS (64.4%), Good Intent Call (11.7%), and Fire (8.7%).
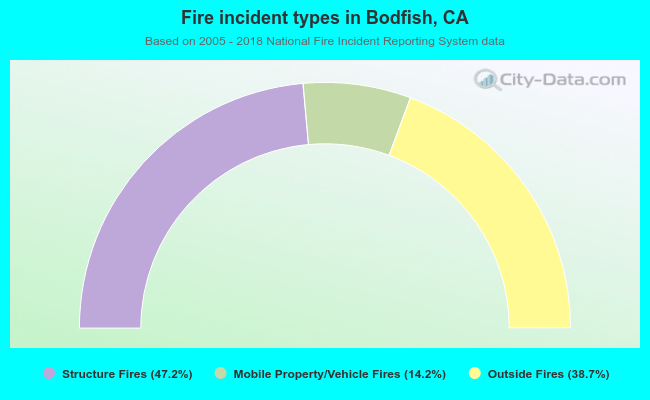 When looking into fire subcategories, the most incidents belonged to: Structure Fires (47.2%), and Outside Fires (38.7%).