Bogalusa: Fire Incidents, Louisiana (LA)
Where are fire incidents reported in Bogalusa, LA
Something went wrong! Please refresh the page.
| Fire incidents reported | |
|---|---|
| Sreet name | Count |
| AVENUE S | 102 |
| COLUMBIA ST | 84 |
| LA 21 | 84 |
| LA 439 | 78 |
| LA 60 | 74 |
| AVENUE U | 72 |
| HWY 21 | 52 |
| LA 1075 | 50 |
| LA 16 | 50 |
| AVENUE B | 46 |
| ROYAL ST | 44 |
| AVENUE F | 42 |
| SUPERIOR AV | 42 |
| AVENUE H | 40 |
| CHOCTAW RD | 40 |
| LA 1074 | 40 |
| SPRING VALLEY RD | 40 |
| 6TH ST | 38 |
| MAIN ST | 38 |
| UNION AV | 38 |
| AVENUE E | 36 |
| KNAPP THOMAS RD | 36 |
| 7TH ST | 34 |
| 8TH ST | 34 |
| FRONT ST | 34 |
| AVENUE G | 32 |
| LA 10 | 32 |
| RIVERSIDE DR | 32 |
| BEN'S FORD RD | 30 |
| COLUMBIA | 30 |
| Other | 1,278 |
2002 - 2018 National Fire Incident Reporting System (NFIRS) incidents
- Incident types reported to NFIRS in Bogalusa, LA
- 4,50345.3%Rescue & EMS
- 2,70227.2%Fire
- 99410.0%Hazardous Condition
- 7207.2%Service Call
- 5655.7%Good Intent Call
- 4404.4%False Alarm
- 100.1%Severe Weather
- Fire incident types reported to NFIRS in Bogalusa, LA
- 1,37650.9%Outside Fires
- 89433.1%Structure Fires
- 30411.3%Mobile Property/Vehicle Fires
- 1284.7%Other
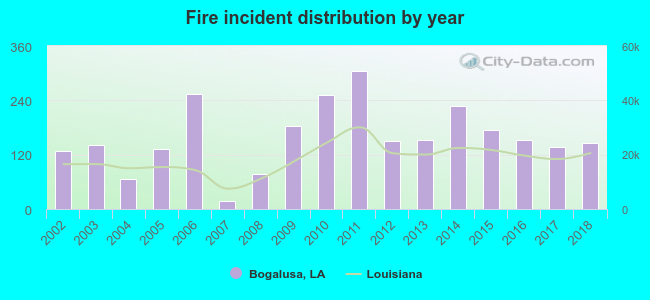 According to the data from the years 2002 - 2018 the average number of fires per year is 159. The highest number of reported fires - 305 took place in 2011, and the least - 18 in 2007. The data has a growing trend.
The average number of yearly fire incidents per 10k residents in Bogalusa, LA compared to nearest cities:
(Note: Based on data for the last 3 years, including only cities with population 5,000 and above)
| Bogalusa: | 122.1 |
| Covington: | 252.3 |
| Mandeville: | 120.4 |
| Lacombe: | 89.9 |
| Slidell: | 101.5 |
| Hammond: | 135.4 |
| Ponchatoula: | 170.4 |
| New Orleans: | 17.3 |
| Metairie: | 15.6 |
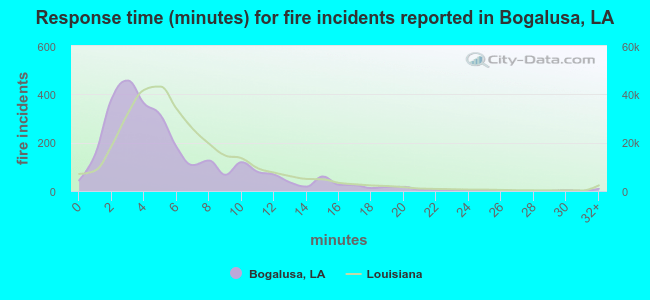 The median response time based on all reported fire incidents is 4 minutes. This is lower than the Louisiana median value.
The median response time in Bogalusa, LA compared to nearest cities:
(Note: Based on data for all years, including only cities with at least 500 fire incidents)
| Bogalusa: | 4 minutes |
| Franklinton: | 7 minutes |
| Folsom: | 7 minutes |
| Covington: | 6 minutes |
| Pearl River: | 8 minutes |
| Mandeville: | 6 minutes |
| Madisonville: | 7 minutes |
| Lacombe: | 7 minutes |
| Slidell: | 6 minutes |
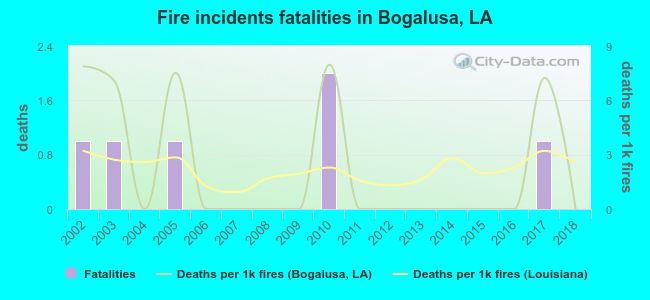 According to the reports from the years 2002 - 2018 the average number of fire-related fatalities per year is 0. The highest number of deaths - 2 took place in 2010, and the lowest - 0 in 2004. The data has a declining trend.
The average number of fatalities per 1,000 fire incidents is 2. This indicator was the highest - 8 in 2010, and the lowest 0 in 2004. The trend for fatalities per 1,000 fires is dropping. Compared to the state value the number of deaths per 1,000 fire incidents is similar.
According to the reports from the years 2002 - 2018 the average number of fire-related fatalities per year is 0. The highest number of deaths - 2 took place in 2010, and the lowest - 0 in 2004. The data has a declining trend.
The average number of fatalities per 1,000 fire incidents is 2. This indicator was the highest - 8 in 2010, and the lowest 0 in 2004. The trend for fatalities per 1,000 fires is dropping. Compared to the state value the number of deaths per 1,000 fire incidents is similar.Deaths per 1,000 incidents in Bogalusa, LA compared to nearest cities:
(Note: Based on data for all years, including only cities with at least 2,500 fire incidents)
| Bogalusa: | 2.2 |
| Covington: | 2.3 |
| Mandeville: | 0.7 |
| Slidell: | 1.8 |
| Hammond: | 1.4 |
| New Orleans: | 1.9 |
| Metairie: | 2.3 |
| Kenner: | 1.7 |
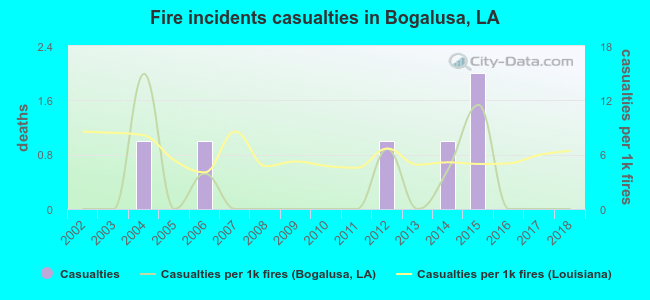 According to the data from the years 2002 - 2018 the average number of fire-related yearly casualties is 0. The highest number of casualties - 2 took place in 2015, and the lowest - 0 in 2002. The data has a constant trend.
The average number of casualties per 1,000 fire incidents is 2. This indicator was the highest - 15 in 2004, and the lowest 0 in 2002. The trend for injuries per 1,000 incidents is constant. Compared to the state value the number of casualties per 1,000 fire incidents is much lower.
According to the data from the years 2002 - 2018 the average number of fire-related yearly casualties is 0. The highest number of casualties - 2 took place in 2015, and the lowest - 0 in 2002. The data has a constant trend.
The average number of casualties per 1,000 fire incidents is 2. This indicator was the highest - 15 in 2004, and the lowest 0 in 2002. The trend for injuries per 1,000 incidents is constant. Compared to the state value the number of casualties per 1,000 fire incidents is much lower.Casualties per 1,000 incidents in Bogalusa, LA compared to nearest cities:
(Note: Based on data for all years, including only cities with at least 500 fire incidents)
| Bogalusa: | 2.2 |
| Franklinton: | 1.1 |
| Folsom: | 0.0 |
| Covington: | 8.8 |
| Pearl River: | 3.2 |
| Mandeville: | 7.5 |
| Madisonville: | 0.0 |
| Lacombe: | 1.5 |
| Slidell: | 6.2 |
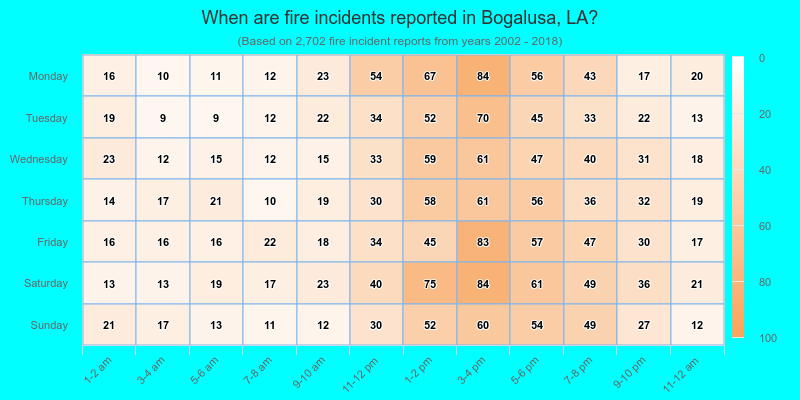
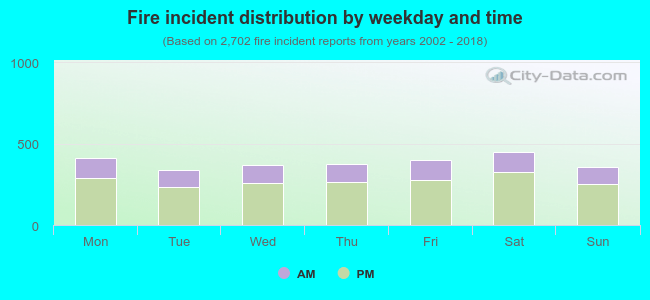 29.7% incidents where reported in the morning and 70.3% in the evening. The most fires (16.7%) took place on Saturday, and the least (12.6%) on Tuesday.
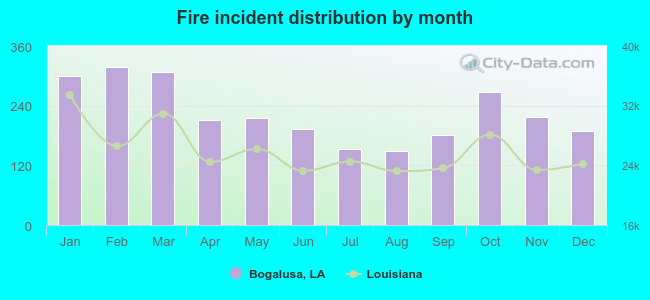 According to the 2,702 fire incident reports from years 2002 - 2018 most fires (11.8%) took place during February, and the least (5.5%) in August.
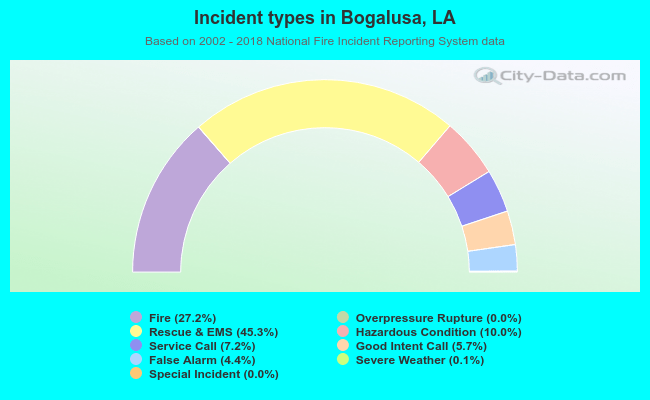 Out of all 9,940 cases reported during the years 2002 - 2018, the most belonged to the categories: Rescue & EMS (45.3%), Fire (27.2%), and Hazardous Condition (10.0%).
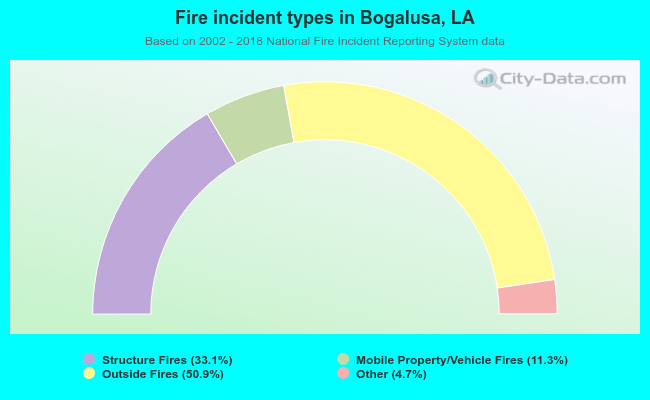 When looking into fire subcategories, the most incidents belonged to: Outside Fires (50.9%), and Structure Fires (33.1%).