Bottineau: Fire Incidents, North Dakota (ND)
Where are fire incidents reported in Bottineau, ND
Something went wrong! Please refresh the page.
|
| |||||||||||||||||||||||||||||||||||||||||||||||||||||||||||||||||||||||||||||||||||||||||||||||||||||||||||||
| Other | 122 | |||||||||||||||||||||||||||||||||||||||||||||||||||||||||||||||||||||||||||||||||||||||||||||||||||||||||||||
2002 - 2018 National Fire Incident Reporting System (NFIRS) incidents
- Incident types reported to NFIRS in Bottineau, ND
- 35076.4%Fire
- 419.0%Hazardous Condition
- 235.0%False Alarm
- 173.7%Rescue & EMS
- 153.3%Service Call
- 102.2%Good Intent Call
- 10.2%Overpressure Rupture
- 10.2%Special Incident
- Fire incident types reported to NFIRS in Bottineau, ND
- 17750.6%Outside Fires
- 8424.0%Mobile Property/Vehicle Fires
- 8022.9%Structure Fires
- 92.6%Other
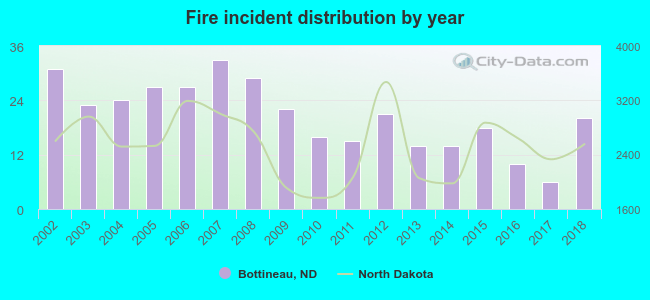 According to the data from the years 2002 - 2018 the average number of fires per year is 21. The highest number of fire incidents - 33 took place in 2007, and the least - 6 in 2017. The data has a declining trend.
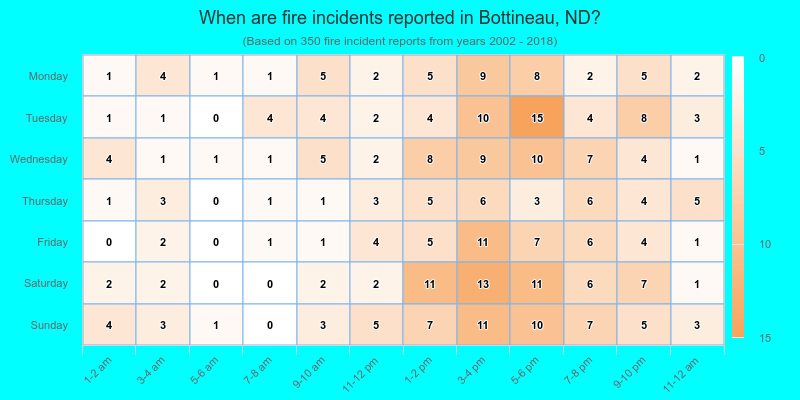
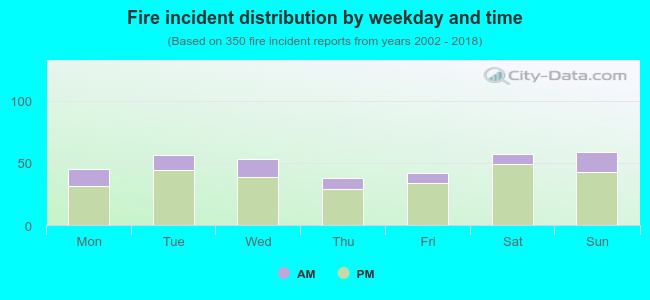 23.1% incidents where reported in the morning and 76.9% in the evening. The most fires (16.9%) took place on Sunday, and the least (10.9%) on Thursday.
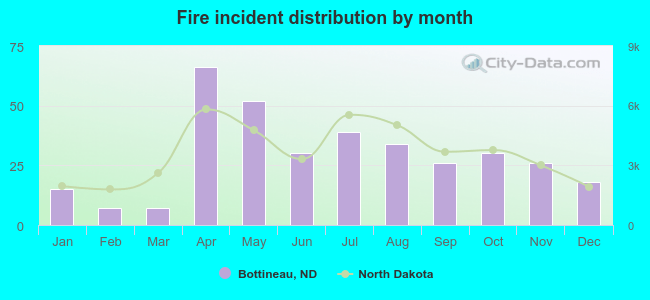 Based on the 350 incident reports from years 2002 - 2018 most fires (18.9%) took place during April, and the least (2.0%) in February.
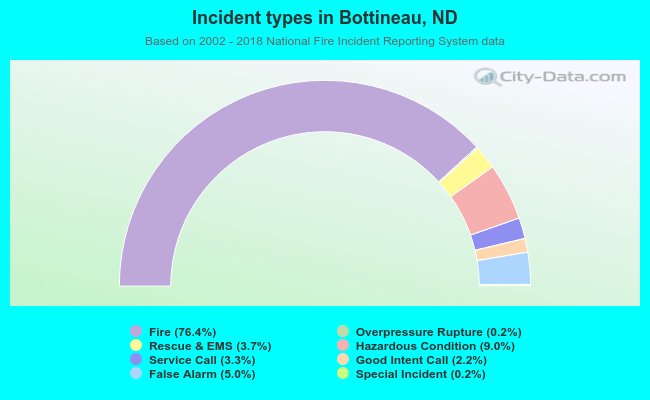 Out of all 458 cases reported during the years 2002 - 2018, the most belonged to the categories: Fire (76.4%), Hazardous Condition (9.0%), and False Alarm (5.0%).
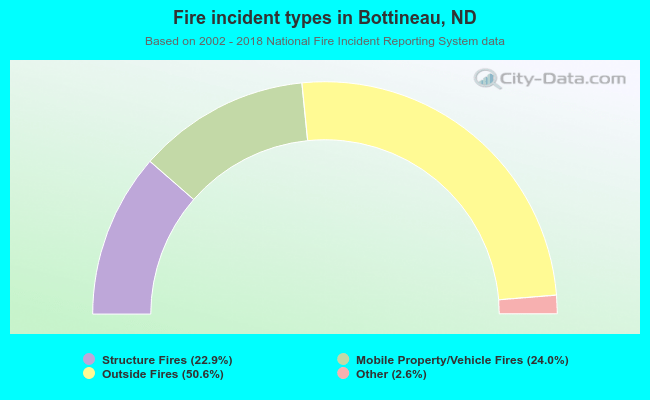 When looking into fire subcategories, the most incidents belonged to: Outside Fires (50.6%), and Mobile Property/Vehicle Fires (24.0%).