Bound Brook: Fire Incidents, New Jersey (NJ)
Where are fire incidents reported in Bound Brook, NJ
Something went wrong! Please refresh the page.
|
| |||||||||||||||||||||||||||||||||||||||||||||||||||||||||||||||||||||||||||||||||||||||||||||||||||||||||||||
2003 - 2018 National Fire Incident Reporting System (NFIRS) incidents
- Incident types reported to NFIRS in Bound Brook, NJ
- 23848.4%Hazardous Condition
- 21543.7%Fire
- 183.7%Service Call
- 153.0%False Alarm
- 30.6%Rescue & EMS
- 30.6%Good Intent Call
- Fire incident types reported to NFIRS in Bound Brook, NJ
- 10347.9%Structure Fires
- 7133.0%Outside Fires
- 3014.0%Mobile Property/Vehicle Fires
- 115.1%Other
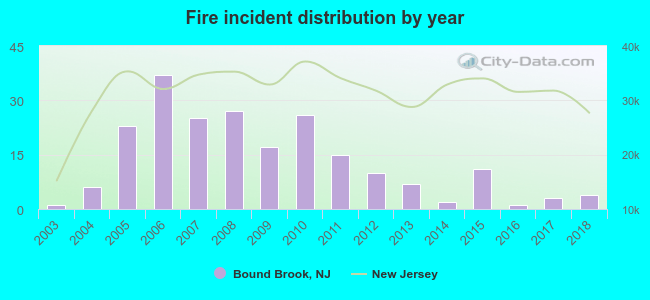 According to the data from the years 2003 - 2018 the average number of fires per year is 13. The highest number of reported fire incidents - 37 took place in 2006, and the least - 1 in 2003. The data has a growing trend.
The average number of yearly fire incidents per 10k residents in Bound Brook, NJ compared to nearest cities:
(Note: Based on data for the last 3 years, including only cities with population 5,000 and above)
| Bound Brook: | 2.4 |
| Finderne: | 1.8 |
| Middlesex: | 2.9 |
| Martinsville: | 19.5 |
| Manville: | 7.7 |
| Somerville: | 36.8 |
| Dunellen: | 9.0 |
| Raritan: | 23.5 |
| Somerset: | 43.2 |
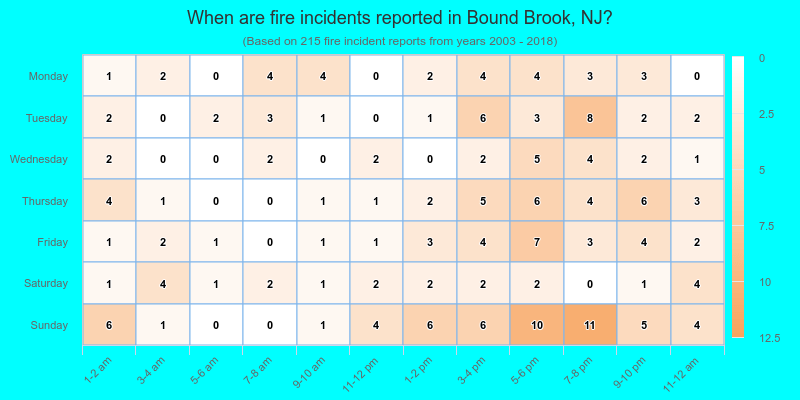
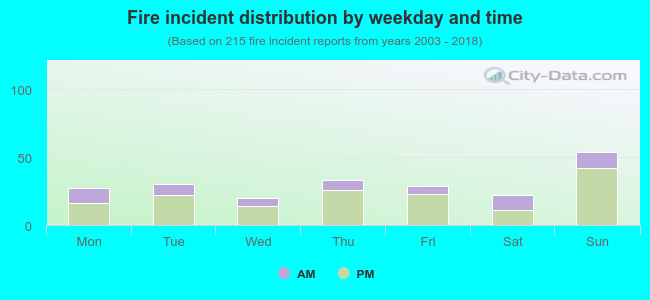 28.4% incidents where reported in the morning and 71.6% in the evening. The most fires (25.1%) took place on Sunday, and the least (9.3%) on Wednesday.
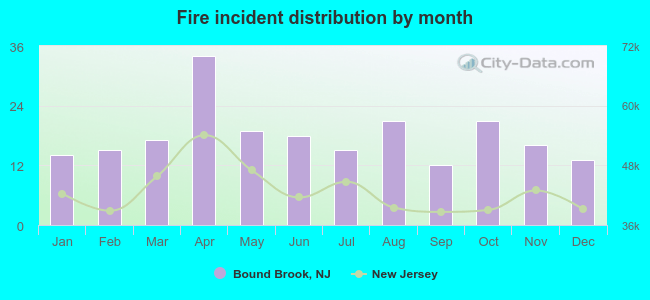 Based on the 215 fire incident reports from years 2003 - 2018 most fires (15.8%) took place during April, and the least (5.6%) in September.
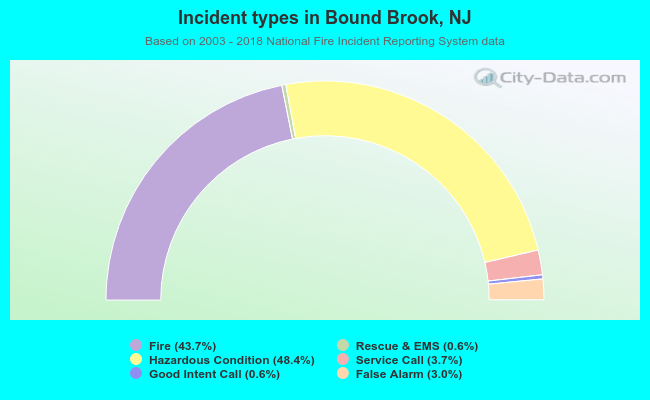 Out of all 492 cases reported during the years 2003 - 2018, the most belonged to the categories: Rescue & EMS (48.4%), Fire (43.7%), and Hazardous Condition (3.7%).
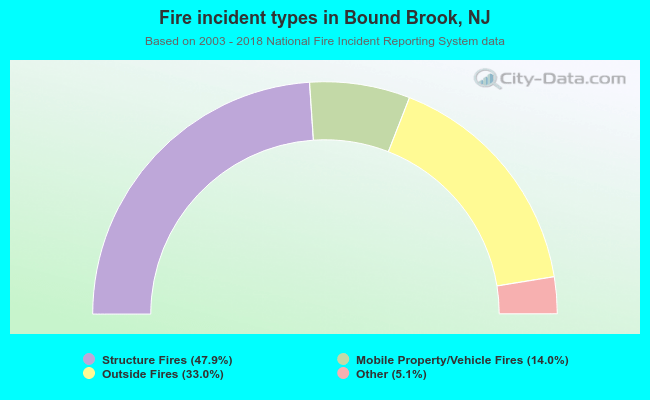 When looking into fire subcategories, the most reports belonged to: Structure Fires (47.9%), and Outside Fires (33.0%).