| Fire incidents reported |
|---|
| Sreet name | Count |
|---|
| US HWY 206 HWY | 52 | | MILL ST | 38 | | WANTAGE AVE | 26 | | MATTISON AVE | 16 | | MORRIS TPKE | 14 | | BROAD ST | 12 | | MATTISON RD | 12 | | PLAINS RD | 12 | | COUNTY ROUTE 519 | 10 | | FOX HILL RD | 10 | | KEMAH LAKE RD | 10 | | PINES RD | 10 | | DAVID DR | 8 | | DICKERSON RD | 8 | | EAST SHORE CULVERS RD | 8 | | GUNN RD | 8 | | HAGGERTY RD | 8 | | MATTISON RESIVOIR RD | 8 | | NEWTON AVE | 8 | | WEST OWASSA TPKE | 8 | | BRANCHVILLE FIRE HOUSE | 6 | | COUNTY ROUTE 565 HWY | 6 | | EAST SHORE CULVER RD | 6 | | EAST SHORE LAKE OWASSA RD | 6 | | GEORGE HILL | 6 |
| | | Fire incidents reported |
|---|
| Sreet name | Count |
|---|
| HYATT RD | 6 | | KLIMAS RD | 6 | | LOWER NORTH SHORE | 6 | | MILK ST | 6 | | PROSPECT STREET | 6 | | RIDGE RD | 6 | | ROSLYN RD | 6 | | ROUTE 206 | 6 | | UNION TPKE | 6 | | BONNING RD | 4 | | FIRST AVE | 4 | | FOURTH ST | 4 | | HAMPTON HOUSE RD | 4 | | LAKEVIEW WALK | 4 | | MAPLE AVE | 4 | | MATTISON RD | 4 | | MATTISON RESEVOIR RD | 4 | | MILK STREET | 4 | | MORRIS TURNPIKE | 4 | | OWASSA TPKE | 4 | | PHILLIPS RD | 4 | | PLUMER RD | 4 | | RAILROAD AVE | 4 | | RT 565 | 4 | | SUMMIT | 4 |
|
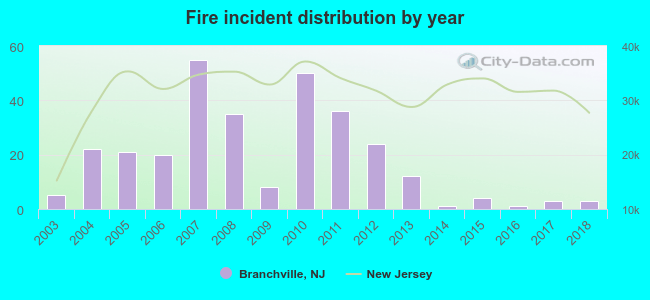 According to the data from the years 2003 - 2018 the average number of fires per year is 19. The highest number of reported fire incidents - 55 took place in 2007, and the least - 1 in 2014. The data has a dropping trend.
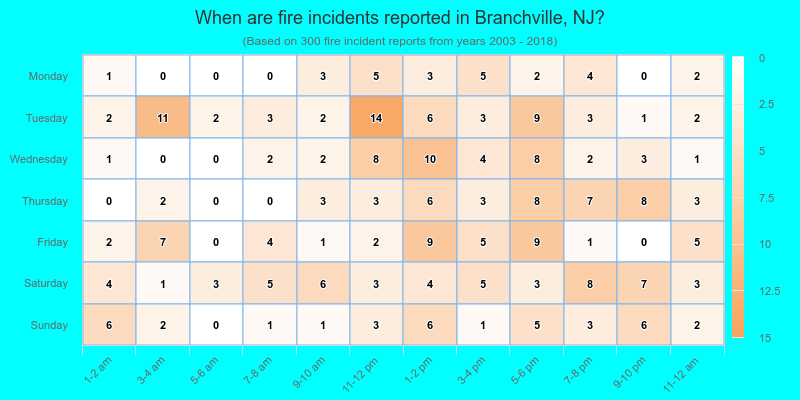
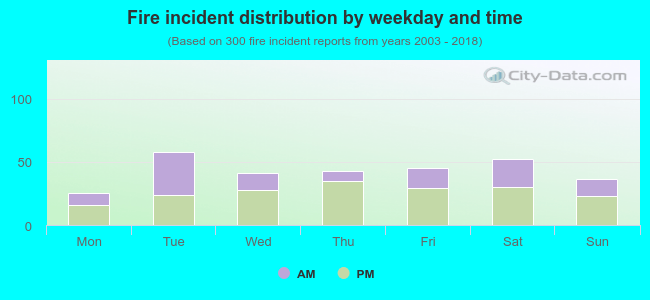 38.3% incidents where reported in the morning and 61.7% in the evening. The most fires (19.3%) took place on Tuesday, and the least (8.3%) on Monday.
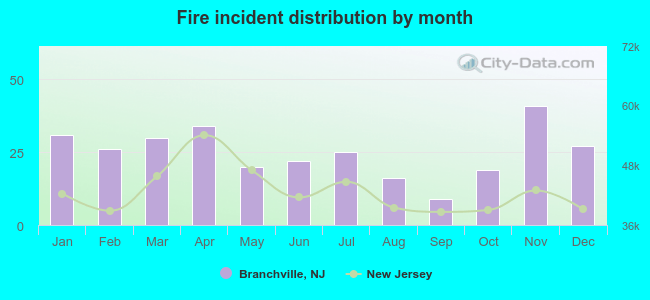 Based on the 300 fire incident reports from years 2003 - 2018 most fires (13.7%) took place during November, and the least (3.0%) in September.
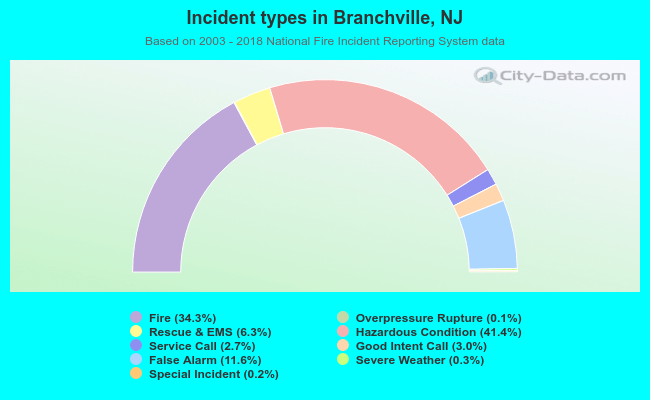 Out of all 874 cases reported during the years 2003 - 2018, the most belonged to the categories: Hazardous Condition (41.4%), Fire (34.3%), and False Alarm (11.6%).
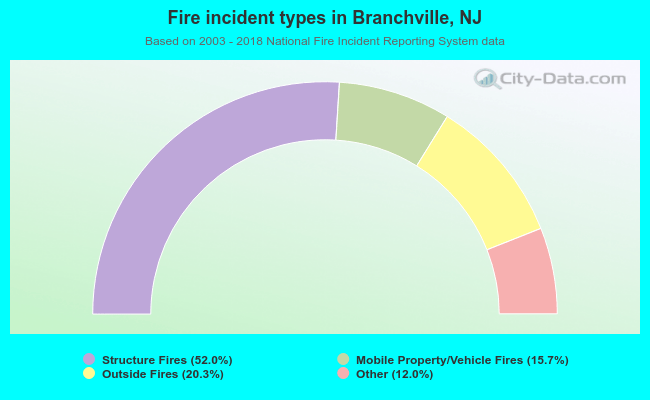 When looking into fire subcategories, the most reports belonged to: Structure Fires (52.0%), and Outside Fires (20.3%).