Bristol: Fire Incidents, Vermont (VT)
Where are fire incidents reported in Bristol, VT
Something went wrong! Please refresh the page.
|
| |||||||||||||||||||||||||||||||||||||||||||||||||||||||||||||||||||||||||||||||||||||||||||||||||||||||||||||
| Other | 39 | |||||||||||||||||||||||||||||||||||||||||||||||||||||||||||||||||||||||||||||||||||||||||||||||||||||||||||||
2002 - 2018 National Fire Incident Reporting System (NFIRS) incidents
- Incident types reported to NFIRS in Bristol, VT
- 30538.4%Fire
- 18022.6%Rescue & EMS
- 17021.4%Hazardous Condition
- 8210.3%False Alarm
- 344.3%Good Intent Call
- 222.8%Service Call
- 10.1%Overpressure Rupture
- 10.1%Severe Weather
- Fire incident types reported to NFIRS in Bristol, VT
- 18360.0%Structure Fires
- 7323.9%Outside Fires
- 258.2%Other
- 247.9%Mobile Property/Vehicle Fires
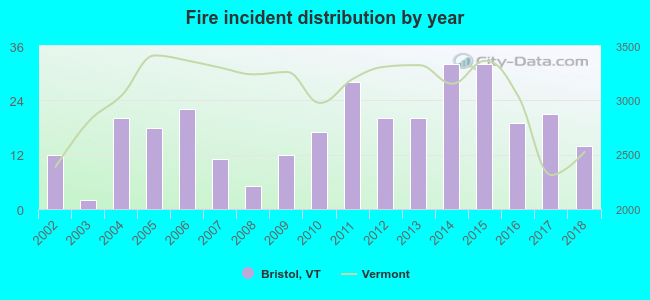 According to the data from the years 2002 - 2018 the average number of fires per year is 18. The highest number of fire incidents - 32 took place in 2014, and the least - 2 in 2003. The data has an increasing trend.
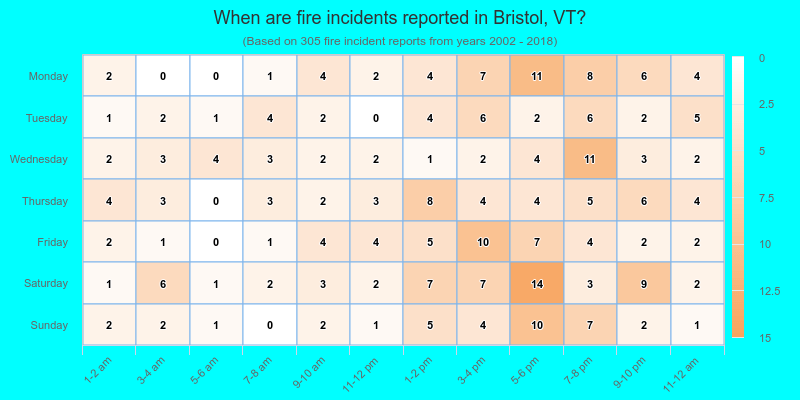
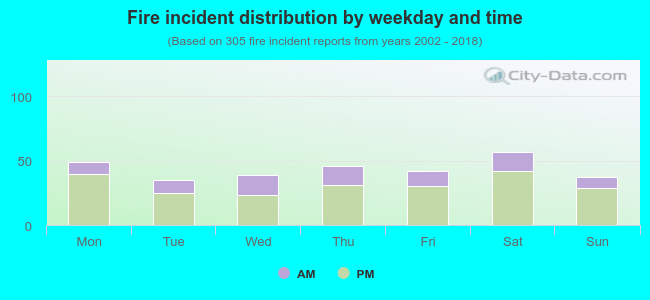 27.9% incidents where reported in the morning and 72.1% in the evening. The most fires (18.7%) took place on Saturday, and the least (11.5%) on Tuesday.
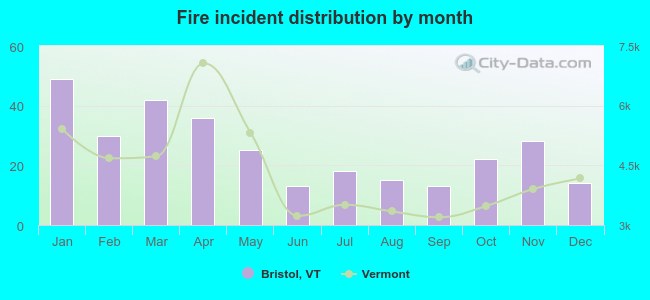 Based on the 305 reports from years 2002 - 2018 most fires (16.1%) took place during January, and the least (4.3%) in June.
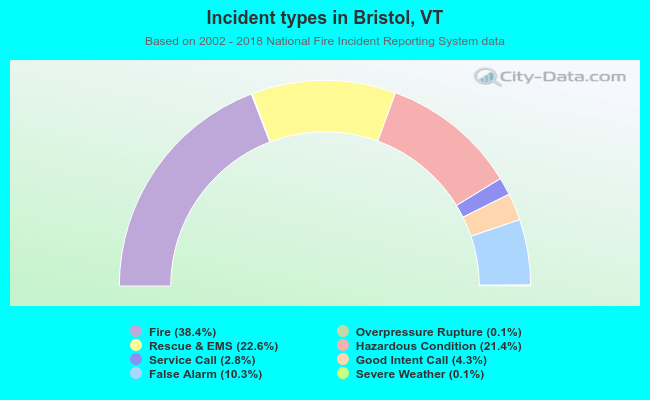 Out of all 795 cases reported during the years 2002 - 2018, the most belonged to the categories: Fire (38.4%), Rescue & EMS (22.6%), and Hazardous Condition (21.4%).
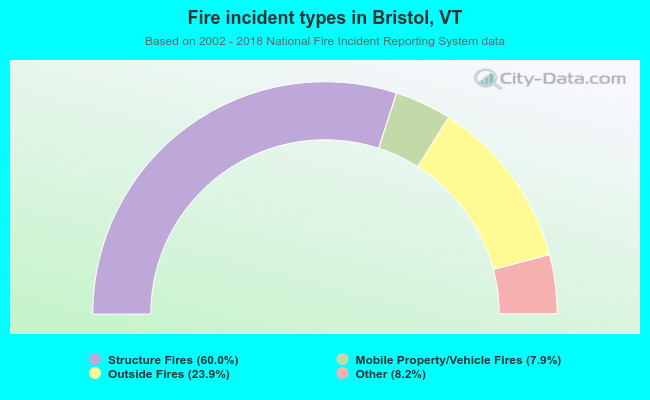 When looking into fire subcategories, the most incidents belonged to: Structure Fires (60.0%), and Outside Fires (23.9%).