Broadview: Fire Incidents, Illinois (IL)
Where are fire incidents reported in Broadview, IL
Something went wrong! Please refresh the page.
| Fire incidents reported | |
|---|---|
| Sreet name | Count |
| 17TH AVE | 110 |
| ROOSEVELT RD | 102 |
| 15TH AVE | 92 |
| 25TH AVE | 92 |
| GARDNER RD | 86 |
| BROADVIEW VILLAGE SQ | 84 |
| 16TH AVE | 70 |
| 13TH AVE | 56 |
| CERMAK RD | 52 |
| 14TH AVE | 46 |
| 16TH | 46 |
| 19TH AVE | 44 |
| 21ST AVE | 34 |
| 11TH AVE | 32 |
| 10TH AVE | 30 |
| 20TH AVE | 30 |
| GARDNER | 30 |
| 15TH | 28 |
| 24TH AVE | 28 |
| 18TH AVE | 26 |
| I 290 | 26 |
| 10TH | 24 |
| 11TH | 24 |
| 13TH | 20 |
| 17TH | 20 |
| 22ND AVE | 20 |
| 12TH AVE | 18 |
| 19TH | 18 |
| 19TH ST | 18 |
| ROOSEVELT | 18 |
2002 - 2018 National Fire Incident Reporting System (NFIRS) incidents
- Incident types reported to NFIRS in Broadview, IL
- 3,68449.0%Rescue & EMS
- 98413.1%Hazardous Condition
- 96912.9%False Alarm
- 89211.9%Fire
- 5337.1%Service Call
- 4205.6%Good Intent Call
- 220.3%Overpressure Rupture
- Fire incident types reported to NFIRS in Broadview, IL
- 49655.6%Structure Fires
- 16718.7%Outside Fires
- 13815.5%Mobile Property/Vehicle Fires
- 9110.2%Other
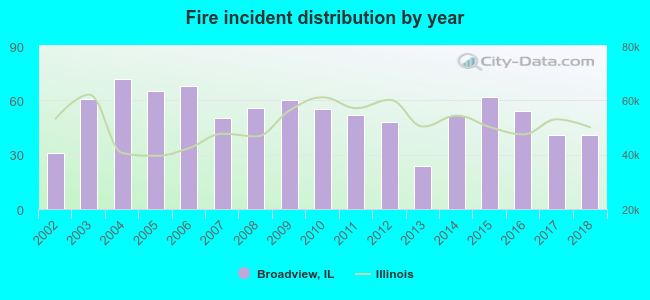 According to the data from the years 2002 - 2018 the average number of fires per year is 52. The highest number of fires - 72 took place in 2004, and the least - 24 in 2013. The data has a growing trend.
The average number of yearly fire incidents per 10k residents in Broadview, IL compared to nearest cities:
(Note: Based on data for the last 3 years, including only cities with population 5,000 and above)
| Broadview: | 57.0 |
| North Riverside: | 31.4 |
| Westchester: | 37.1 |
| Maywood: | 58.8 |
| Bellwood: | 43.3 |
| La Grange Park: | 15.4 |
| Forest Park: | 45.8 |
| Brookfield: | 36.6 |
| Hillside: | 67.1 |
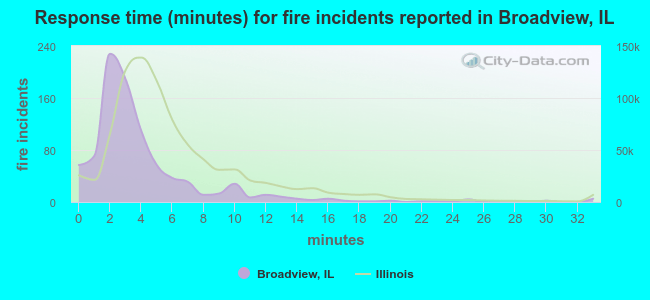 The median response time based on all reported fire incidents is 3 minutes. This is lower compared to the state median value.
The median response time in Broadview, IL compared to nearest cities:
(Note: Based on data for all years, including only cities with at least 500 fire incidents)
| Broadview: | 3 minutes |
| Westchester: | 4 minutes |
| Maywood: | 3 minutes |
| Bellwood: | 3 minutes |
| Forest Park: | 5 minutes |
| Brookfield: | 5 minutes |
| Hillside: | 4 minutes |
| Riverside: | 6 minutes |
| Melrose Park: | 4 minutes |
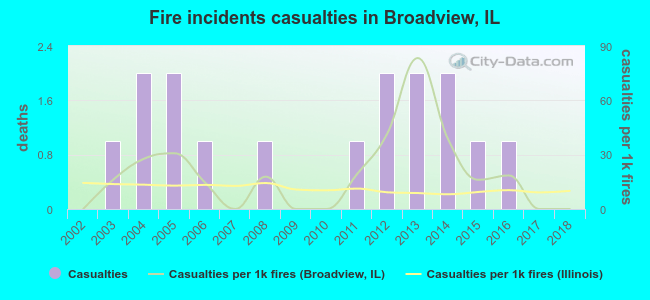 According to the reports from the years 2002 - 2018 the average number of fire-related yearly casualties is 1. The highest number of injuries - 2 took place in 2004, and the lowest - 0 in 2002. The data has a constant trend.
The average number of casualties per 1,000 fires is 19. This indicator was the highest - 83 in 2013, and the lowest 0 in 2002. The trend for casualties per 1,000 incidents is constant. Compared to the state value the number of injuries per 1,000 fires is higher.
According to the reports from the years 2002 - 2018 the average number of fire-related yearly casualties is 1. The highest number of injuries - 2 took place in 2004, and the lowest - 0 in 2002. The data has a constant trend.
The average number of casualties per 1,000 fires is 19. This indicator was the highest - 83 in 2013, and the lowest 0 in 2002. The trend for casualties per 1,000 incidents is constant. Compared to the state value the number of injuries per 1,000 fires is higher.Casualties per 1,000 incidents in Broadview, IL compared to nearest cities:
(Note: Based on data for all years, including only cities with at least 500 fire incidents)
| Broadview: | 17.9 |
| Westchester: | 15.6 |
| Maywood: | 6.1 |
| Bellwood: | 5.1 |
| Forest Park: | 8.3 |
| Brookfield: | 19.1 |
| Hillside: | 17.0 |
| Riverside: | 11.7 |
| Melrose Park: | 12.3 |
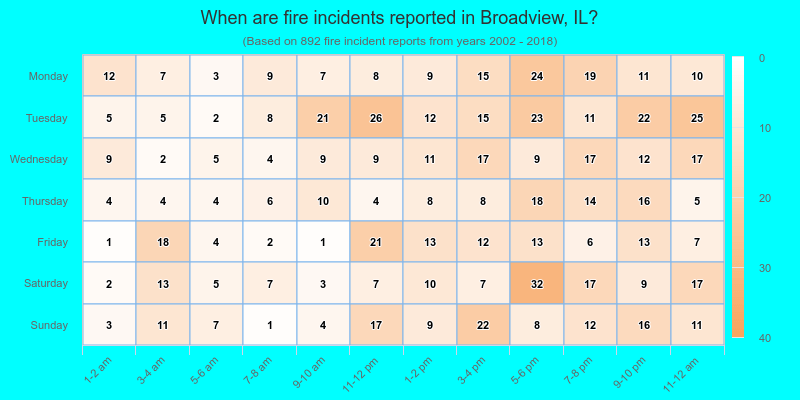
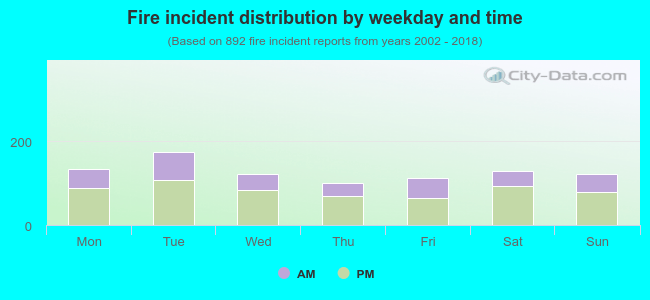 34.8% incidents where reported in the morning and 65.2% in the evening. The most fires (19.6%) took place on Tuesday, and the least (11.3%) on Thursday.
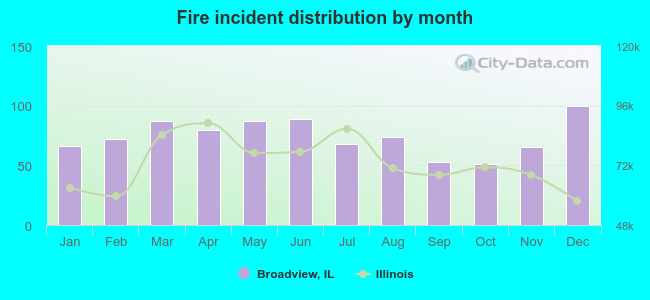 Based on the 892 fire incidents from years 2002 - 2018 most fires (11.2%) took place during December, and the least (5.7%) in October.
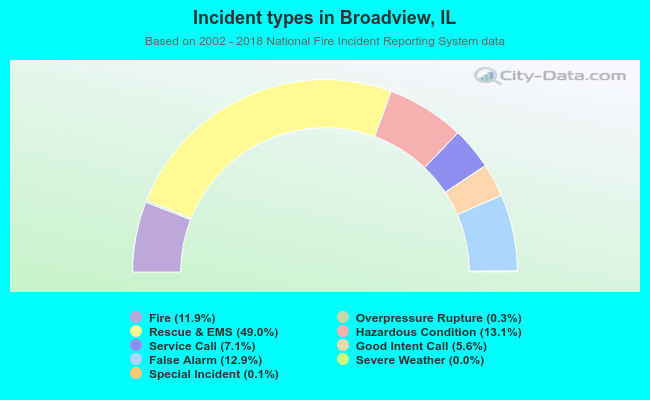 Out of all 7,514 cases reported during the years 2002 - 2018, the most belonged to the categories: Rescue & EMS (49.0%), Hazardous Condition (13.1%), and False Alarm (12.9%).
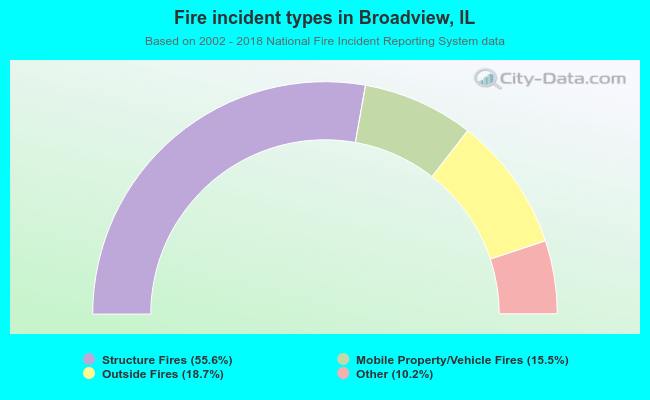 When looking into fire subcategories, the most incidents belonged to: Structure Fires (55.6%), and Outside Fires (18.7%).