Brown Deer: Fire Incidents, Wisconsin (WI)
Where are fire incidents reported in Brown Deer, WI
Something went wrong! Please refresh the page.
|
| |||||||||||||||||||||||||||||||||||||||||||||||||||||||||||||||||||||||||||||||||||||||||||||||||||||||||||||
2002 - 2018 National Fire Incident Reporting System (NFIRS) incidents
- Incident types reported to NFIRS in Brown Deer, WI
- 5,57073.8%Rescue & EMS
- 97813.0%False Alarm
- 3534.7%Hazardous Condition
- 3034.0%Fire
- 1692.2%Service Call
- 1151.5%Good Intent Call
- 520.7%Special Incident
- Fire incident types reported to NFIRS in Brown Deer, WI
- 15751.8%Structure Fires
- 9330.7%Outside Fires
- 4715.5%Mobile Property/Vehicle Fires
- 62.0%Other
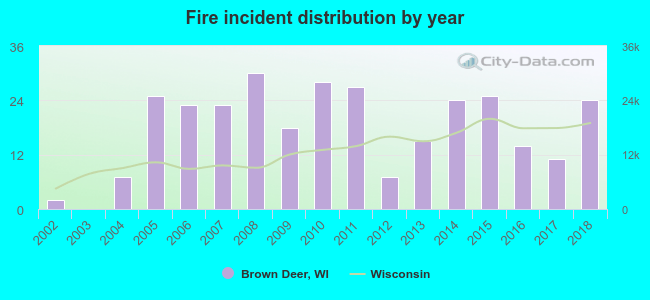 Based on the data from the years 2002 - 2018 the average number of fire incidents per year is 18. The highest number of reported fire incidents - 30 took place in 2008, and the least - 0 in 2003. The data has a growing trend.
The average number of yearly fire incidents per 10k residents in Brown Deer, WI compared to nearest cities:
(Note: Based on data for the last 3 years, including only cities with population 5,000 and above)
| Brown Deer: | 13.5 |
| Mequon: | 6.0 |
| Fox Point: | 10.9 |
| Glendale: | 23.0 |
| Whitefish Bay: | 7.1 |
| Menomonee Falls: | 22.0 |
| Shorewood: | 10.0 |
| Germantown: | 31.0 |
| Wauwatosa: | 16.1 |
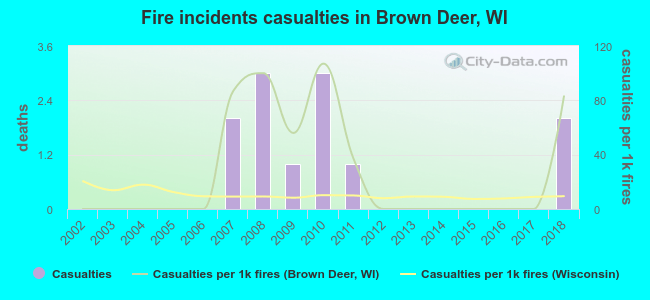 According to the data from the years 2002 - 2018 the average number of fire-related casualties per year is 1. The highest number of injuries - 3 took place in 2008, and the lowest - 0 in 2002. The data has an increasing trend.
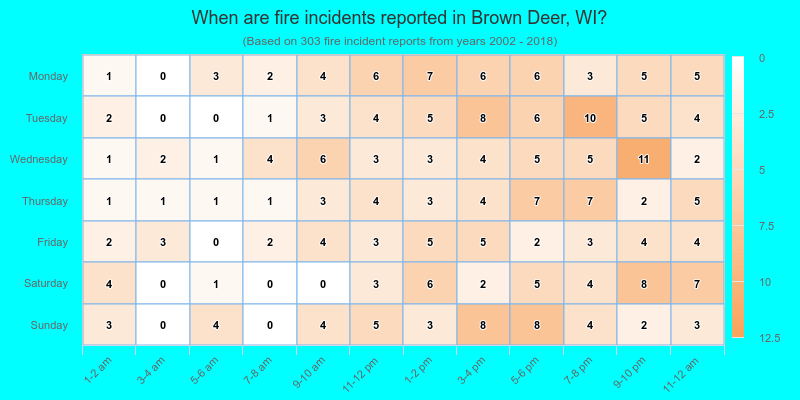
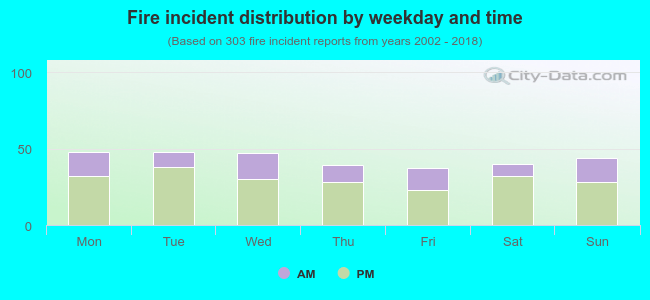 30.4% incidents where reported in the morning and 69.6% in the evening. The most fires (15.8%) took place on Monday, and the least (12.2%) on Friday.
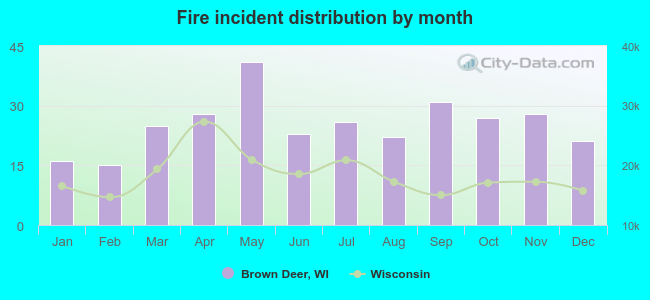 According to the 303 fire incidents from years 2002 - 2018 most fires (13.5%) took place during May, and the least (5.0%) in February.
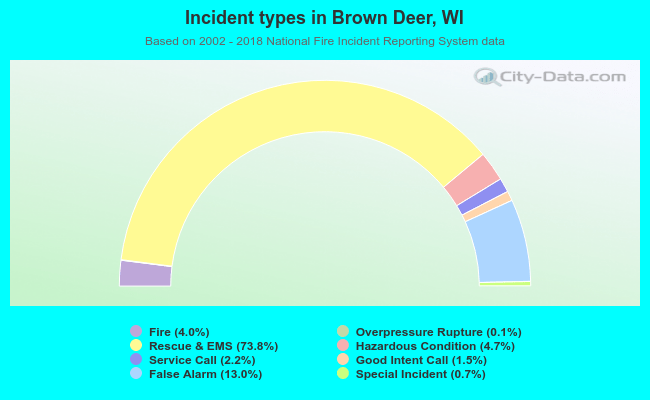 Out of all 7,547 cases reported during the years 2002 - 2018, the most belonged to the categories: Rescue & EMS (73.8%), False Alarm (13.0%), and Hazardous Condition (4.7%).
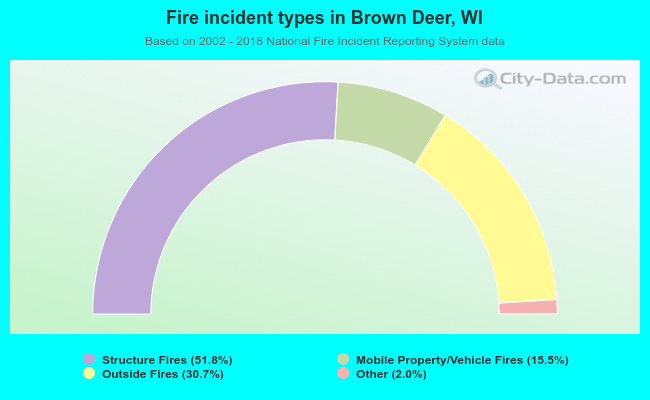 When looking into fire subcategories, the most reports belonged to: Structure Fires (51.8%), and Outside Fires (30.7%).