Bryan: Fire Incidents, Ohio (OH)
Where are fire incidents reported in Bryan, OH
Something went wrong! Please refresh the page.
| Fire incidents reported | |
|---|---|
| Sreet name | Count |
| MAIN ST | 128 |
| HIGH ST | 108 |
| CHERRY ST | 64 |
| UNION ST | 64 |
| WALNUT ST | 62 |
| WILSON ST | 54 |
| 15 | 44 |
| WILLIAMS ST | 44 |
| ST RTE 34 | 36 |
| LYNN ST | 34 |
| BRYAN ST | 32 |
| BEECH ST | 30 |
| CO RD C | 30 |
| CO RD F | 30 |
| US RTE 6 | 30 |
| ST RTE 15 | 26 |
| TREVITT ST | 26 |
| US RTE 127 | 24 |
| PERRY ST | 22 |
| 18 | 20 |
| BUTLER ST | 20 |
| CENTER ST | 20 |
| EDGERTON ST | 20 |
| ST RTE 576 | 20 |
| MULBERRY ST | 18 |
| MYERS ST | 18 |
| 34 | 16 |
| ALLEN ST | 16 |
| CO RD 10 | 16 |
| CO RD 15 | 16 |
| Other | 183 |
2002 - 2018 National Fire Incident Reporting System (NFIRS) incidents
- Incident types reported to NFIRS in Bryan, OH
- 1,27130.6%Fire
- 89621.6%Hazardous Condition
- 77318.6%Rescue & EMS
- 44910.8%Good Intent Call
- 3929.4%Service Call
- 3217.7%False Alarm
- 250.6%Overpressure Rupture
- 190.5%Special Incident
- 50.1%Severe Weather
- Fire incident types reported to NFIRS in Bryan, OH
- 71155.9%Structure Fires
- 39030.7%Outside Fires
- 16813.2%Mobile Property/Vehicle Fires
- 20.2%Other
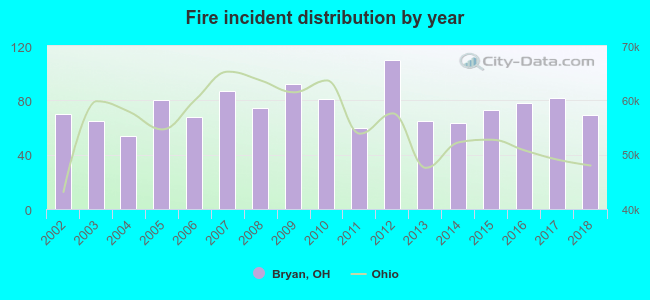 Based on the data from the years 2002 - 2018 the average number of fires per year is 75. The highest number of reported fires - 110 took place in 2012, and the least - 54 in 2004. The data has a declining trend.
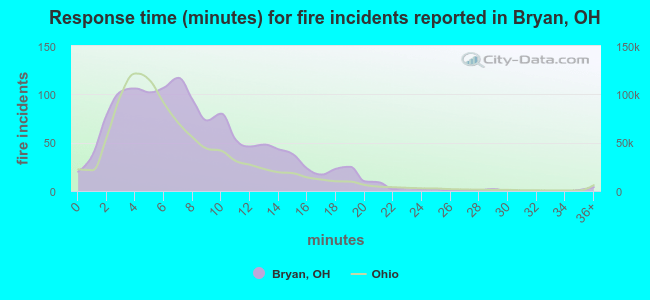 The median response time based on all reported fire incidents is 7 minutes. This is comparable to the Ohio median value.
The median response time in Bryan, OH compared to nearest cities:
(Note: Based on data for all years, including only cities with at least 500 fire incidents)
| Bryan: | 7 minutes |
| Montpelier: | 8 minutes |
| Archbold: | 6 minutes |
| Defiance: | 8 minutes |
| Hicksville: | 7 minutes |
| Butler: | 10 minutes |
| Wauseon: | 7 minutes |
| Napoleon: | 7 minutes |
| Paulding: | 12 minutes |
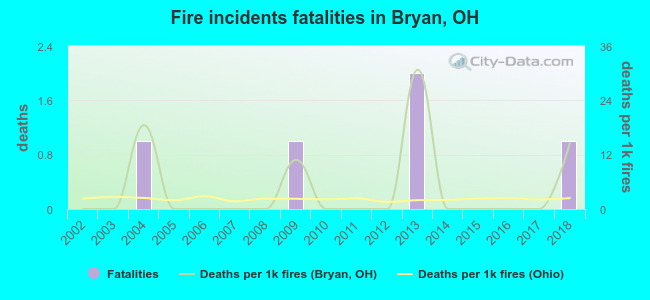 According to the data from the years 2002 - 2018 the average number of fire-related fatalities per year is 0. The highest number of reported deaths - 2 took place in 2013, and the lowest - 0 in 2002. The data has an increasing trend.
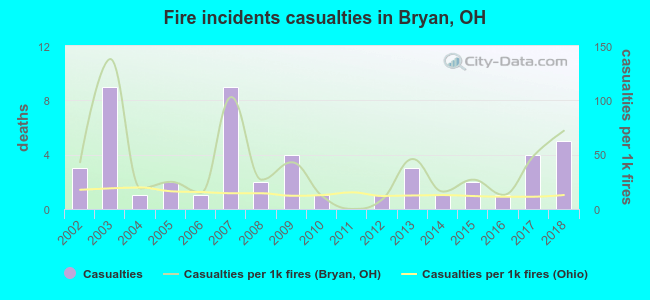 Based on the reports from the years 2002 - 2018 the average number of fire-related yearly casualties is 3. The highest number of reported casualties - 9 took place in 2003, and the lowest - 0 in 2011. The data has a rising trend.
The average number of injuries per 1,000 fire incidents is 39. This indicator was the highest - 138 in 2003, and the lowest 0 in 2011. The trend for casualties per 1,000 incidents is rising. Compared to the state value the number of casualties per 1,000 fire incidents is much higher.
Based on the reports from the years 2002 - 2018 the average number of fire-related yearly casualties is 3. The highest number of reported casualties - 9 took place in 2003, and the lowest - 0 in 2011. The data has a rising trend.
The average number of injuries per 1,000 fire incidents is 39. This indicator was the highest - 138 in 2003, and the lowest 0 in 2011. The trend for casualties per 1,000 incidents is rising. Compared to the state value the number of casualties per 1,000 fire incidents is much higher.Casualties per 1,000 incidents in Bryan, OH compared to nearest cities:
(Note: Based on data for all years, including only cities with at least 500 fire incidents)
| Bryan: | 38.6 |
| Montpelier: | 8.6 |
| Archbold: | 10.0 |
| Defiance: | 13.6 |
| Hicksville: | 3.0 |
| Butler: | 0.0 |
| Wauseon: | 22.3 |
| Napoleon: | 32.3 |
| Paulding: | 1.9 |
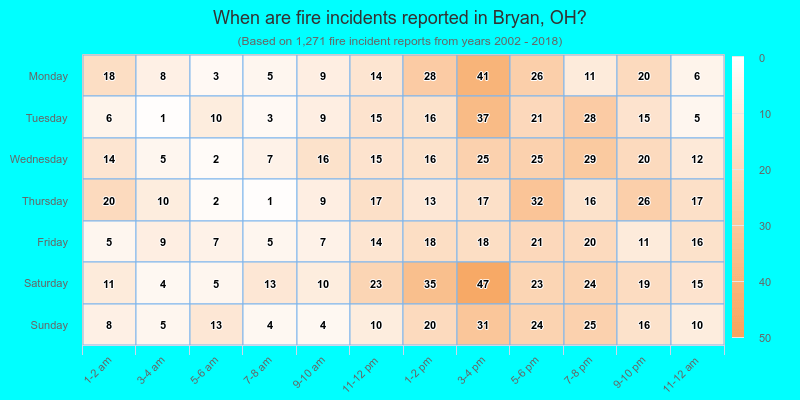
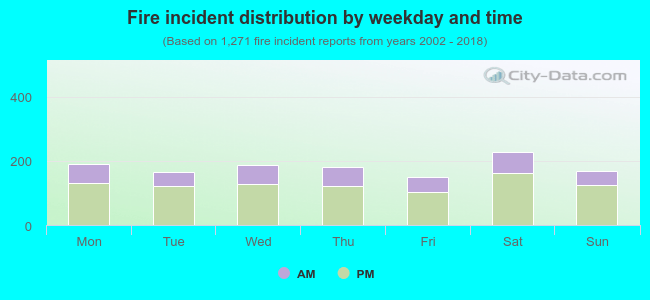 29.6% incidents where reported in the morning and 70.4% in the evening. The most fires (18.0%) took place on Saturday, and the least (11.9%) on Friday.
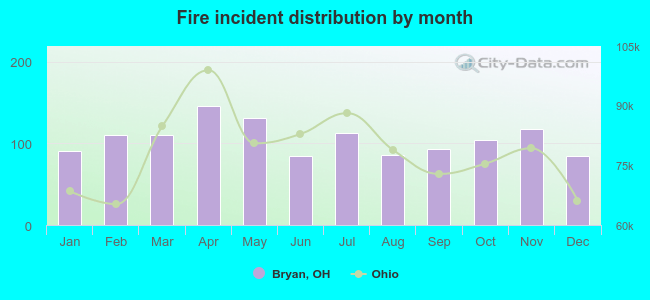 According to the 1,271 fires from years 2002 - 2018 most fires (11.5%) took place during April, and the least (6.6%) in June.
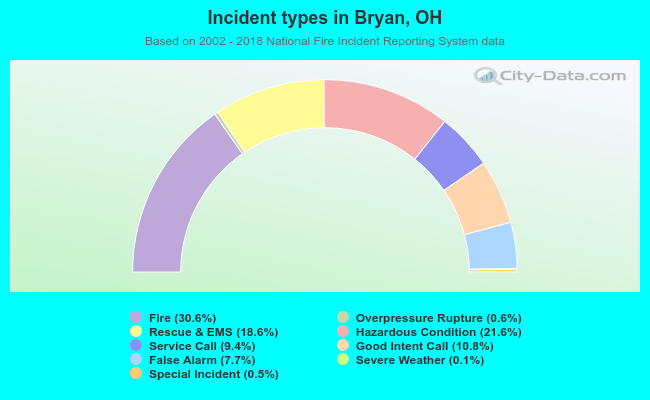 Out of all 4,151 cases reported during the years 2002 - 2018, the most belonged to the categories: Fire (30.6%), Hazardous Condition (21.6%), and Rescue & EMS (18.6%).
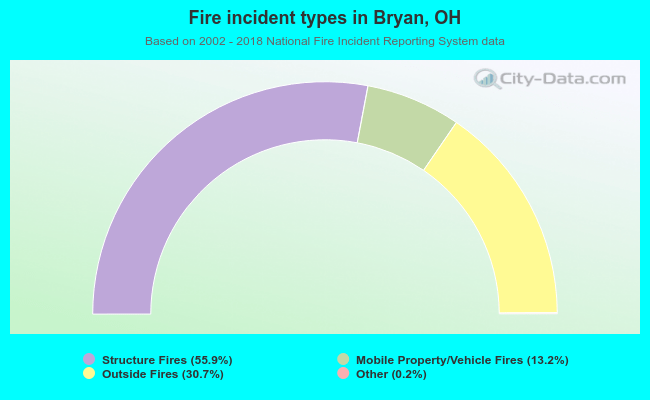 When looking into fire subcategories, the most reports belonged to: Structure Fires (55.9%), and Outside Fires (30.7%).