Buellton: Fire Incidents, California (CA)
Where are fire incidents reported in Buellton, CA
Something went wrong! Please refresh the page.
|
| |||||||||||||||||||||||||||||||||||||||||||||||||||||||||||||||||||||||||||||||||||||||||||||||||||||||||||||
2005 - 2018 National Fire Incident Reporting System (NFIRS) incidents
- Incident types reported to NFIRS in Buellton, CA
- 1,24756.8%Rescue & EMS
- 32014.6%Good Intent Call
- 2059.3%Service Call
- 1958.9%Fire
- 1255.7%False Alarm
- 924.2%Hazardous Condition
- 40.2%Overpressure Rupture
- 40.2%Severe Weather
- 40.2%Special Incident
- Fire incident types reported to NFIRS in Buellton, CA
- 11257.4%Outside Fires
- 4322.1%Mobile Property/Vehicle Fires
- 3517.9%Structure Fires
- 52.6%Other
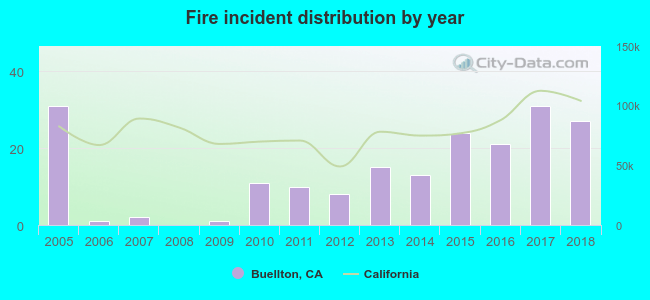 Based on the data from the years 2005 - 2018 the average number of fire incidents per year is 14. The highest number of fire incidents - 31 took place in 2005, and the least - 0 in 2008. The data has a decreasing trend.
The average number of yearly fire incidents per 10k residents in Buellton, CA compared to nearest cities:
(Note: Based on data for the last 3 years, including only cities with population 5,000 and above)
| Buellton: | 52.2 |
| Solvang: | 27.8 |
| Lompoc: | 43.0 |
| Orcutt: | 2.1 |
| Isla Vista: | 7.5 |
| Goleta: | 26.2 |
| Santa Maria: | 28.3 |
| Santa Barbara: | 23.4 |
| Guadalupe: | 29.8 |
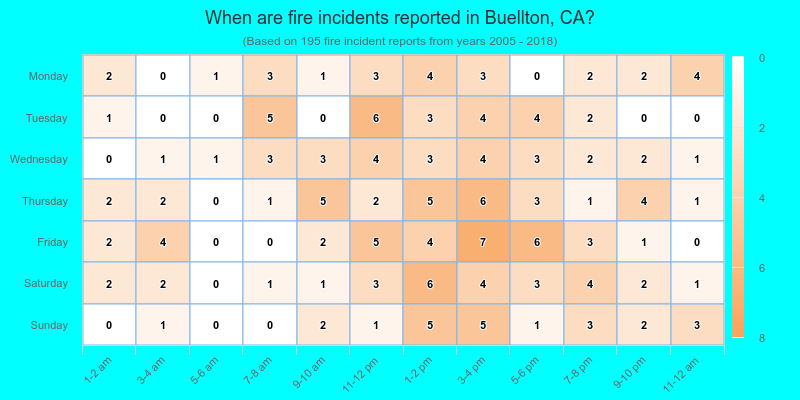
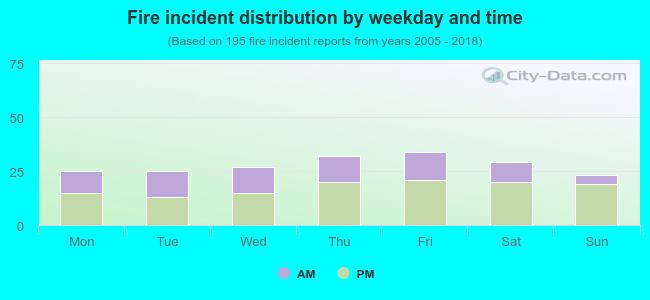 36.9% incidents where reported in the morning and 63.1% in the evening. The most fires (17.4%) took place on Friday, and the least (11.8%) on Sunday.
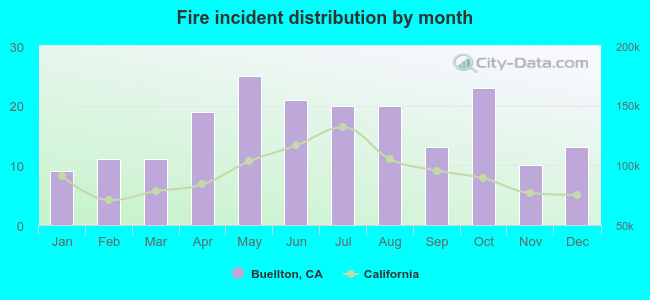 According to the 195 fire incident reports from years 2005 - 2018 most fires (12.8%) took place during May, and the least (4.6%) in January.
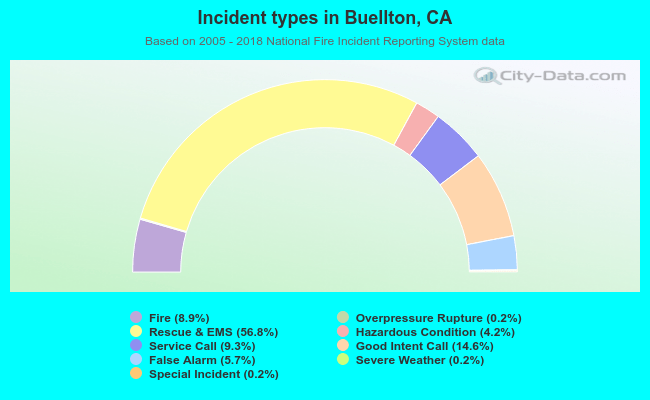 Out of all 2,196 cases reported during the years 2005 - 2018, the most belonged to the categories: Rescue & EMS (56.8%), Good Intent Call (14.6%), and Service Call (9.3%).
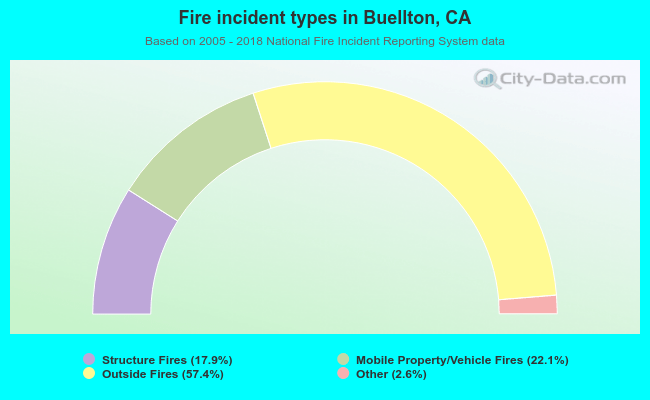 When looking into fire subcategories, the most reports belonged to: Outside Fires (57.4%), and Mobile Property/Vehicle Fires (22.1%).