Burney: Fire Incidents, California (CA)
Where are fire incidents reported in Burney, CA
Something went wrong! Please refresh the page.
|
| |||||||||||||||||||||||||||||||||||||||||||||||||||||||||||||||||||||||||||||||||||||||||||||||||||||||||||||
2005 - 2018 National Fire Incident Reporting System (NFIRS) incidents
- Incident types reported to NFIRS in Burney, CA
- 29271.6%Fire
- 327.8%Hazardous Condition
- 256.1%Service Call
- 204.9%Rescue & EMS
- 204.9%Good Intent Call
- 194.7%False Alarm
- Fire incident types reported to NFIRS in Burney, CA
- 23580.5%Outside Fires
- 3311.3%Structure Fires
- 155.1%Mobile Property/Vehicle Fires
- 93.1%Other
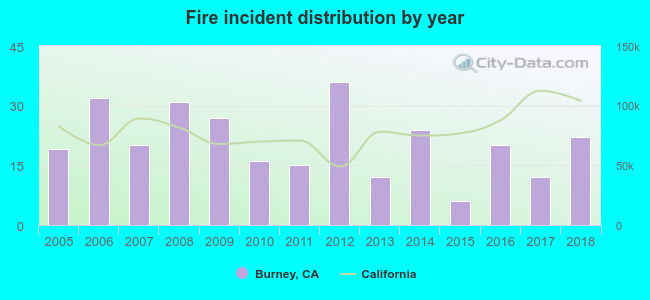 According to the data from the years 2005 - 2018 the average number of fires per year is 21. The highest number of reported fire incidents - 36 took place in 2012, and the least - 6 in 2015. The data has a growing trend.
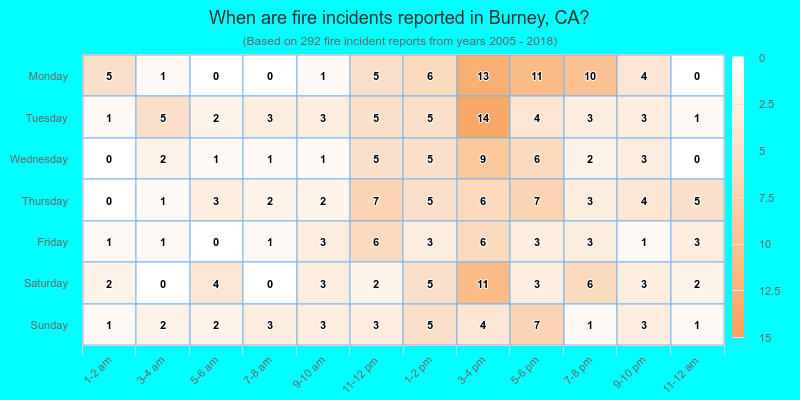
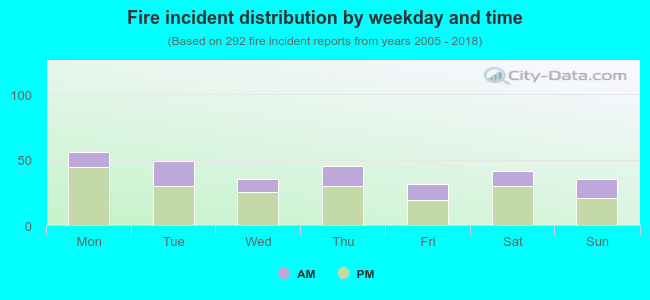 31.8% incidents where reported in the morning and 68.2% in the evening. The most fires (19.2%) took place on Monday, and the least (10.6%) on Friday.
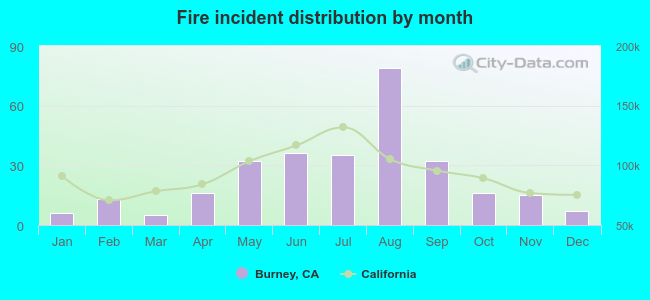 According to the 292 incident reports from years 2005 - 2018 most fires (27.1%) took place during August, and the least (1.7%) in March.
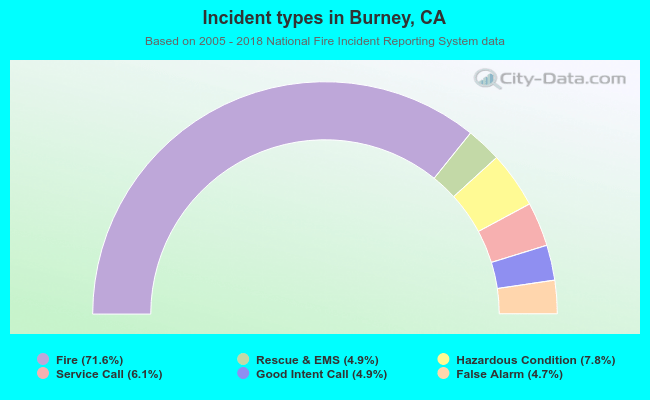 Out of all 408 cases reported during the years 2005 - 2018, the most belonged to the categories: Fire (71.6%), Rescue & EMS (7.8%), and Hazardous Condition (6.1%).
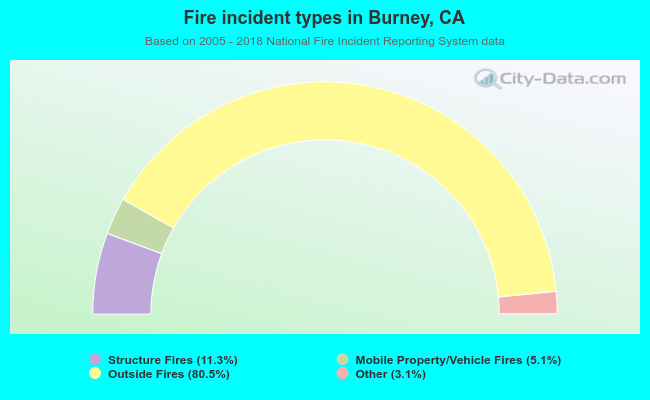 When looking into fire subcategories, the most reports belonged to: Outside Fires (80.5%), and Structure Fires (11.3%).