| Fire incidents reported |
|---|
| Sreet name | Count |
|---|
| 305 6TH STREET | 10 | | CEDAR BAY RD | 8 | | 1 PARK AVENUE | 6 | | 7TH ST | 6 | | TENTH STREET | 6 | | 25609 TEMPLE STREET | 4 | | 5TH ST | 4 | | FIFTH ST | 4 | | MINE STREET | 4 | | OSCEOLA ROAD | 4 | | TECUMSEH ROAD | 4 | | 1 PARK AVE | 2 | | 101 6TH STREET | 2 | | 10TH AND SCOTT STREET | 2 | | 10TH AND SCOTT STREETS | 2 | | 112 5TH STREET | 2 | | 114 5TH STREET | 2 | | 117 5TH STREET | 2 | | 1ST ST | 2 | | 20992 M 26 | 2 | | 215 6TH STREET | 2 | | 22080 M203 | 2 | | 23748 HIGHWAY LOCATION | 2 | | 23809 ELECTRIC PARK RD | 2 | | 23810 AIRPAK BLVD | 2 |
| | | Fire incidents reported |
|---|
| Sreet name | Count |
|---|
| 24333 ONECO ROAD | 2 | | 24949 CHESTNUT STREET | 2 | | 2503 US 41 | 2 | | 25188 SPRUCE | 2 | | 25208 1ST STREET | 2 | | 25215 ASH STREET | 2 | | 25217 MAPLE STREET | 2 | | 25221 MAPLE STREET TAMARACK LO | 2 | | 25256 RENAISSANCE RD | 2 | | 25507 C STREET | 2 | | 25514 UPPER STREET | 2 | | 25584 C STREET | 2 | | 25880 C STREET | 2 | | 25941 CEDAR STREET | 2 | | 25962 PINE STREET | 2 | | 25998 DEPOT STREET | 2 | | 26096 FRANKLIN ST | 2 | | 26135 PINES STREET | 2 | | 26175 QUINCY STREET | 2 | | 26364 ALANTIC STREET | 2 | | 26378 QUINCY STREET | 2 | | 26765 AMYGALOID ST | 2 | | 26765 AMYGDALOID STREET | 2 | | 27251 AMYGDALOID | 2 | | 30575 LINCOLN SCHOOL RD | 2 |
|
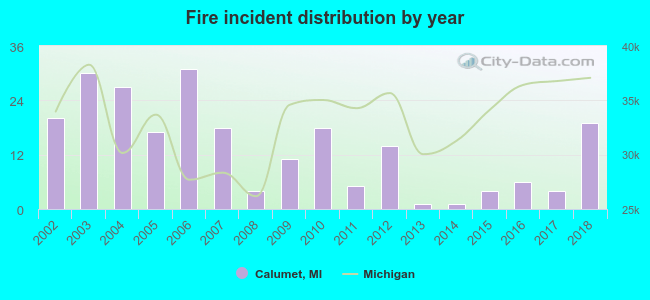 According to the data from the years 2002 - 2018 the average number of fires per year is 14. The highest number of reported fire incidents - 31 took place in 2006, and the least - 1 in 2013. The data has a dropping trend.
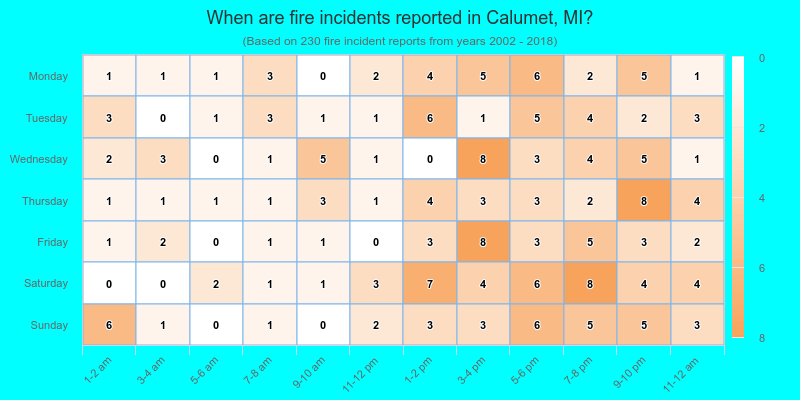
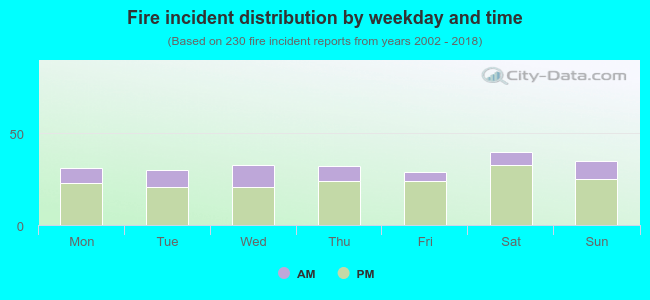 25.7% incidents where reported in the morning and 74.3% in the evening. The most fires (17.4%) took place on Saturday, and the least (12.6%) on Friday.
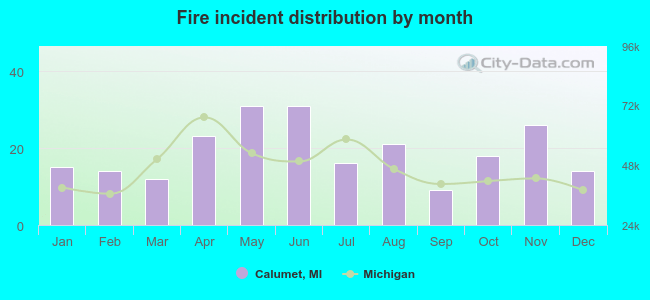 According to the 230 fire incident reports from years 2002 - 2018 most fires (13.5%) took place during May, and the least (3.9%) in September.
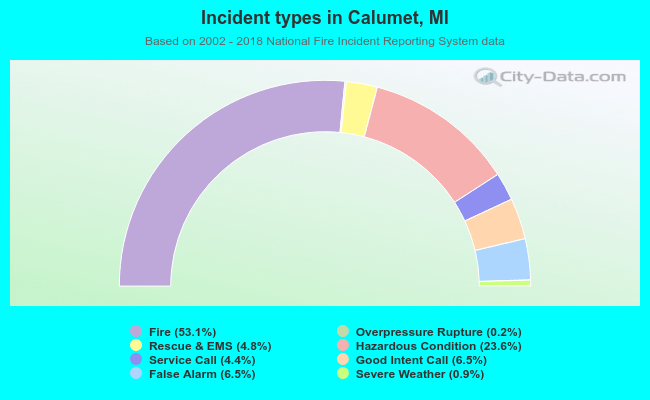 Out of all 433 cases reported during the years 2002 - 2018, the most belonged to the categories: Fire (53.1%), Hazardous Condition (23.6%), and Good Intent Call (6.5%).
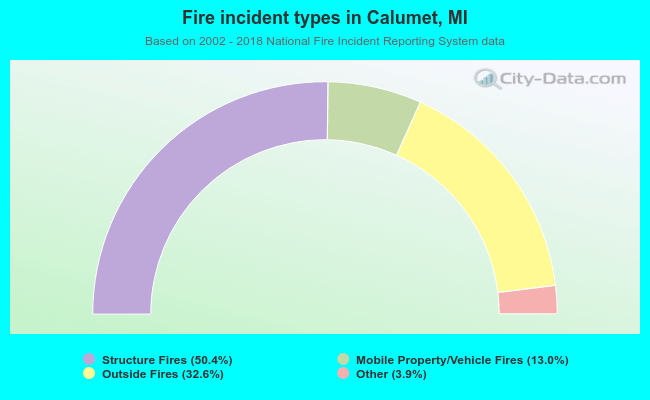 When looking into fire subcategories, the most reports belonged to: Structure Fires (50.4%), and Outside Fires (32.6%).