Camarillo: Fire Incidents, California (CA)
Where are fire incidents reported in Camarillo, CA
Something went wrong! Please refresh the page.
| Fire incidents reported | |
|---|---|
| Sreet name | Count |
| LAS POSAS RD | 100 |
| PONDEROSA DR | 82 |
| PASEO CAMARILLO | 78 |
| ARNEILL RD | 50 |
| PLEASANT VALLEY RD | 50 |
| LAS POSAS | 48 |
| VENTURA BLVD | 48 |
| SANTA ROSA RD | 42 |
| SB 101 SO | 40 |
| DAILY | 34 |
| PONDEROSA | 32 |
| SB 101 AT | 32 |
| VENTURA | 32 |
| LEWIS RD | 30 |
| NB 101 AT | 30 |
| DAILY DR | 28 |
| MISSION OAKS | 28 |
| MISSION OAKS BLVD | 28 |
| TEMPLE AVE | 26 |
| ARNEILL | 22 |
| NB 101 SO | 22 |
| CARMEN | 20 |
| 101 FRWY | 18 |
| ADOLFO RD | 18 |
| CENTRAL AVE | 18 |
| FLYNN | 18 |
| MOBIL AVE | 18 |
| NB 101 NO | 18 |
| PLEASANT VALLEY | 18 |
| SB 101 NO | 18 |
| Other | 400 |
2005 - 2018 National Fire Incident Reporting System (NFIRS) incidents
- Incident types reported to NFIRS in Camarillo, CA
- 17,94570.0%Rescue & EMS
- 2,56510.0%Good Intent Call
- 1,5326.0%Service Call
- 1,4465.6%Fire
- 1,0824.2%Hazardous Condition
- 1,0234.0%False Alarm
- Fire incident types reported to NFIRS in Camarillo, CA
- 45831.7%Outside Fires
- 39627.4%Structure Fires
- 33923.4%Mobile Property/Vehicle Fires
- 25317.5%Other
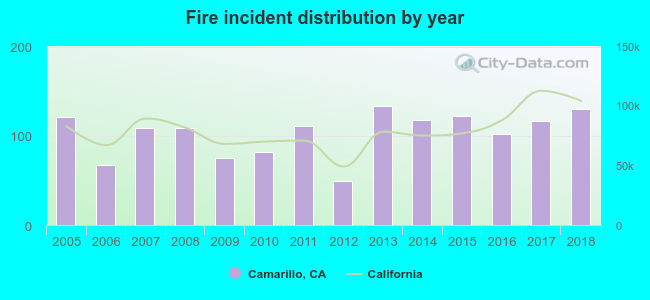 According to the data from the years 2005 - 2018 the average number of fires per year is 103. The highest number of fire incidents - 134 took place in 2013, and the least - 49 in 2012. The data has a rising trend.
The average number of yearly fire incidents per 10k residents in Camarillo, CA compared to nearest cities:
(Note: Based on data for the last 3 years, including only cities with population 5,000 and above)
| Camarillo: | 17.4 |
| El Rio: | 43.5 |
| Oxnard: | 24.6 |
| Santa Paula: | 24.2 |
| Thousand Oaks: | 9.7 |
| Moorpark: | 13.3 |
| Port Hueneme: | 26.3 |
| Ventura: | 37.4 |
| Westlake Village: | 9.0 |
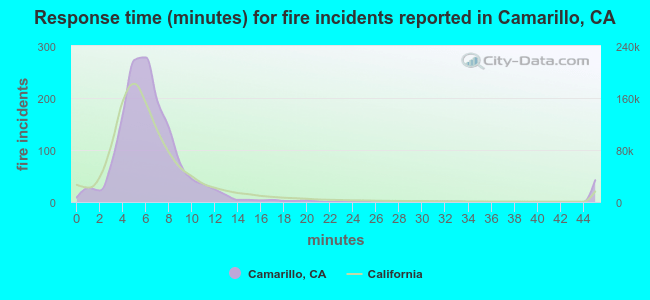 The median response time based on all reported fire incidents is 6 minutes. This is close to the state median value.
The median response time in Camarillo, CA compared to nearest cities:
(Note: Based on data for all years, including only cities with at least 500 fire incidents)
| Camarillo: | 6 minutes |
| Oxnard: | 5 minutes |
| Santa Paula: | 6 minutes |
| Thousand Oaks: | 6 minutes |
| Moorpark: | 7 minutes |
| Port Hueneme: | 6 minutes |
| Ventura: | 7 minutes |
| Simi Valley: | 6 minutes |
| Malibu: | 6 minutes |
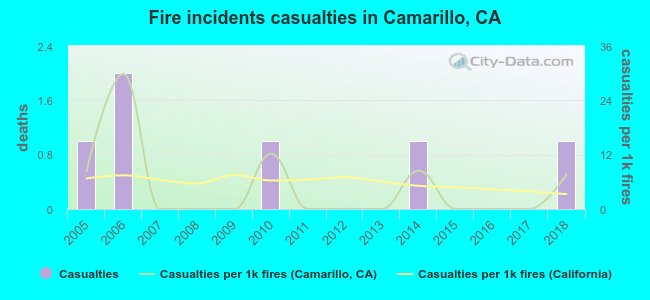 According to the data from the years 2005 - 2018 the average number of fire-related casualties per year is 0. The highest number of injuries - 2 took place in 2006, and the lowest - 0 in 2007. The data has a constant trend.
The average number of injuries per 1,000 fires is 5. This indicator was the highest - 30 in 2006, and the lowest 0 in 2007. The trend for injuries per 1,000 incidents is decreasing. Compared to the California value the number of injuries per 1,000 fires is lower.
According to the data from the years 2005 - 2018 the average number of fire-related casualties per year is 0. The highest number of injuries - 2 took place in 2006, and the lowest - 0 in 2007. The data has a constant trend.
The average number of injuries per 1,000 fires is 5. This indicator was the highest - 30 in 2006, and the lowest 0 in 2007. The trend for injuries per 1,000 incidents is decreasing. Compared to the California value the number of injuries per 1,000 fires is lower.Casualties per 1,000 incidents in Camarillo, CA compared to nearest cities:
(Note: Based on data for all years, including only cities with at least 500 fire incidents)
| Camarillo: | 4.1 |
| Oxnard: | 5.6 |
| Santa Paula: | 6.3 |
| Thousand Oaks: | 9.8 |
| Moorpark: | 2.9 |
| Port Hueneme: | 6.6 |
| Ventura: | 6.0 |
| Simi Valley: | 7.5 |
| Malibu: | 0.0 |
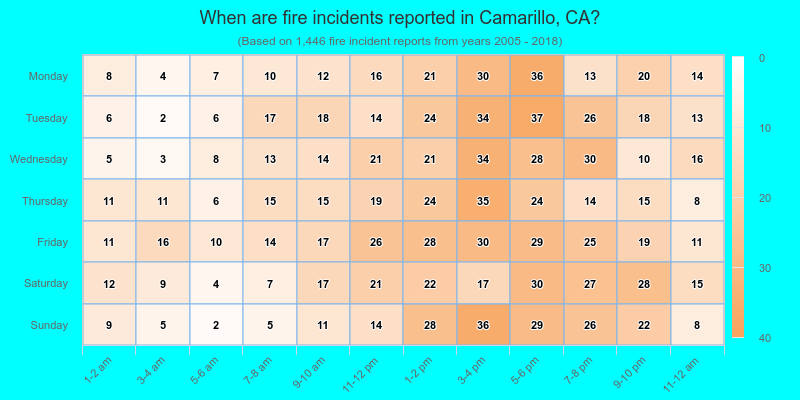
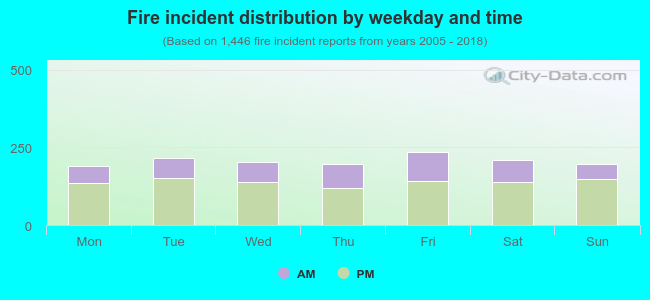 32.6% incidents where reported in the morning and 67.4% in the evening. The most fires (16.3%) took place on Friday, and the least (13.2%) on Monday.
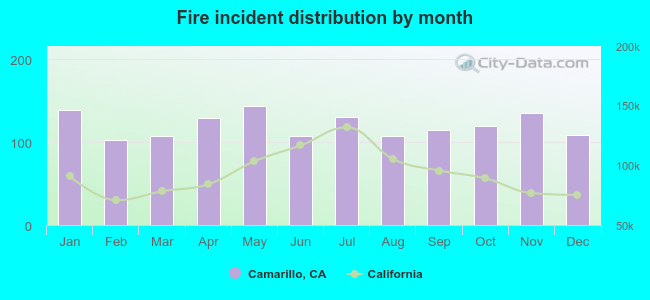 According to the 1,446 fires from years 2005 - 2018 most fires (10.0%) took place during May, and the least (7.1%) in February.
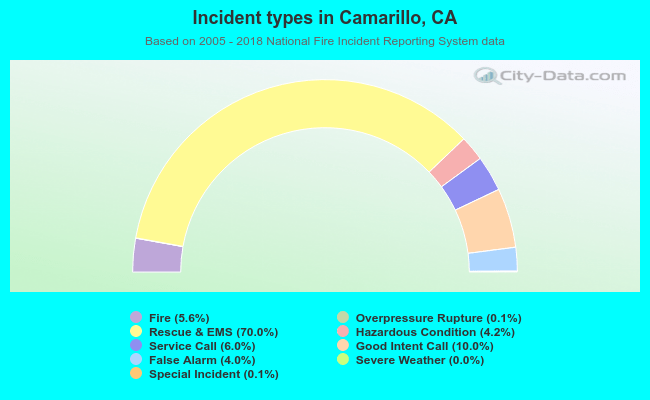 Out of all 25,638 cases reported during the years 2005 - 2018, the most belonged to the categories: Rescue & EMS (70.0%), Good Intent Call (10.0%), and Service Call (6.0%).
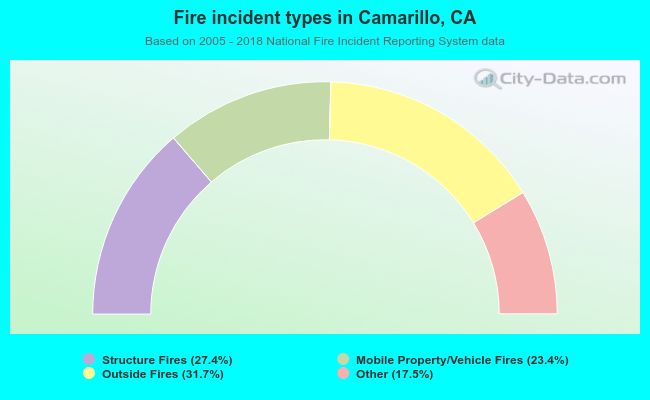 When looking into fire subcategories, the most incidents belonged to: Outside Fires (31.7%), and Structure Fires (27.4%).