Carrier Mills: Fire Incidents, Illinois (IL)
Where are fire incidents reported in Carrier Mills, IL
Something went wrong! Please refresh the page.
|
| |||||||||||||||||||||||||||||||||||||||||||||||||||||||||||||||||||||||||||||||||||||||||||||||||||||||||||||
2002 - 2018 National Fire Incident Reporting System (NFIRS) incidents
- Incident types reported to NFIRS in Carrier Mills, IL
- 39371.6%Fire
- 519.3%Rescue & EMS
- 376.7%Hazardous Condition
- 254.6%Service Call
- 234.2%False Alarm
- 152.7%Good Intent Call
- 40.7%Overpressure Rupture
- 10.2%Special Incident
- Fire incident types reported to NFIRS in Carrier Mills, IL
- 17344.0%Outside Fires
- 16642.2%Structure Fires
- 4712.0%Mobile Property/Vehicle Fires
- 71.8%Other
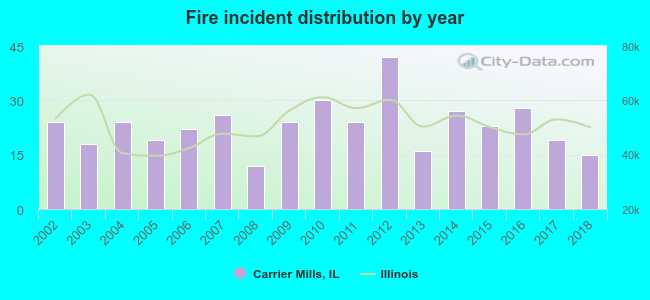 According to the data from the years 2002 - 2018 the average number of fires per year is 23. The highest number of reported fires - 42 took place in 2012, and the least - 12 in 2008. The data has a dropping trend.
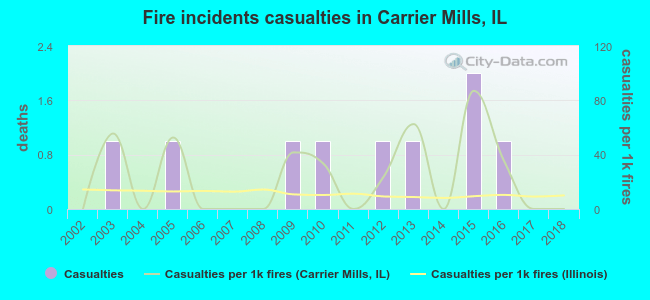 According to the reports from the years 2002 - 2018 the average number of fire-related casualties per year is 1. The highest number of injuries - 2 took place in 2015, and the lowest - 0 in 2002. The data has a constant trend.
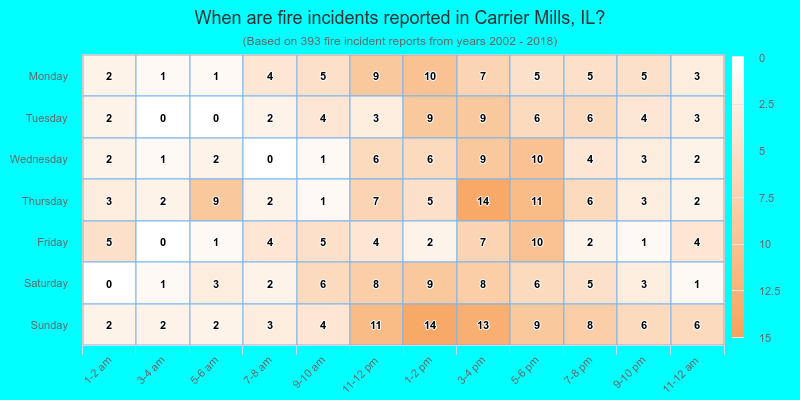
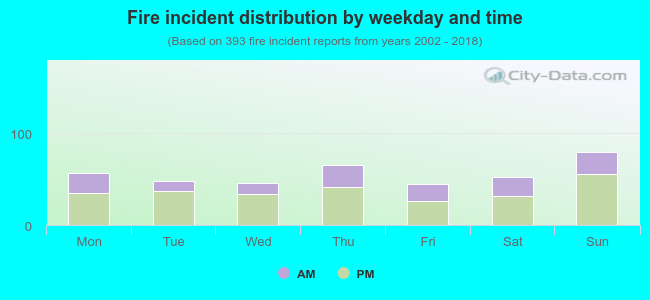 33.6% incidents where reported in the morning and 66.4% in the evening. The most fires (20.4%) took place on Sunday, and the least (11.5%) on Friday.
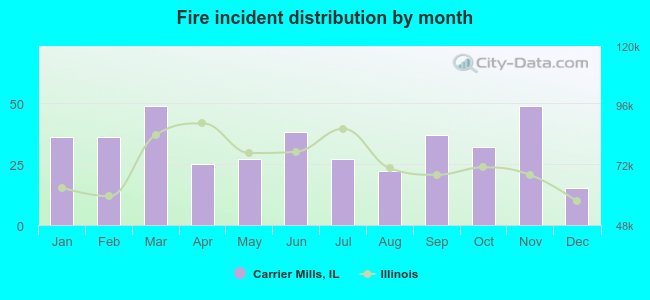 Based on the 393 fire incident reports from years 2002 - 2018 most fires (12.5%) took place during March, and the least (3.8%) in December.
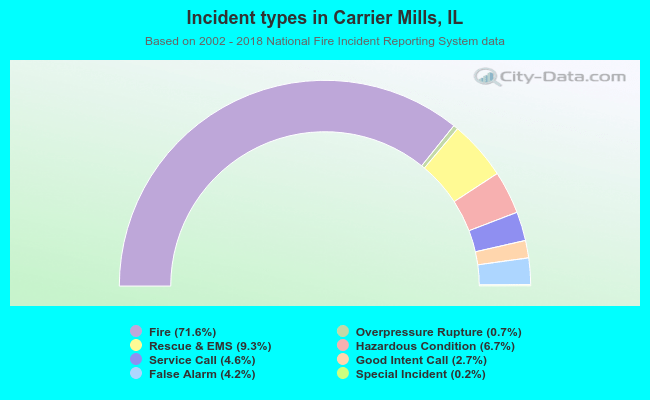 Out of all 549 cases reported during the years 2002 - 2018, the most belonged to the categories: Fire (71.6%), Rescue & EMS (9.3%), and Hazardous Condition (6.7%).
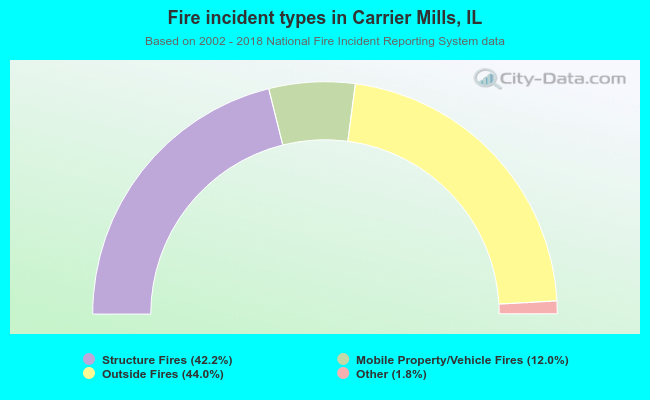 When looking into fire subcategories, the most reports belonged to: Outside Fires (44.0%), and Structure Fires (42.2%).