Cedarville: Fire Incidents, Ohio (OH)
Where are fire incidents reported in Cedarville, OH
Something went wrong! Please refresh the page.
|
| |||||||||||||||||||||||||||||||||||||||||||||||||||||||||||||||||||||||||||||||||||||||||||||||||||||||||||||
2002 - 2018 National Fire Incident Reporting System (NFIRS) incidents
- Incident types reported to NFIRS in Cedarville, OH
- 84838.6%Rescue & EMS
- 44220.1%Hazardous Condition
- 29313.3%Fire
- 27312.4%Good Intent Call
- 22810.4%False Alarm
- 733.3%Service Call
- 231.0%Severe Weather
- 140.6%Overpressure Rupture
- Fire incident types reported to NFIRS in Cedarville, OH
- 15251.9%Structure Fires
- 9532.4%Outside Fires
- 4114.0%Mobile Property/Vehicle Fires
- 51.7%Other
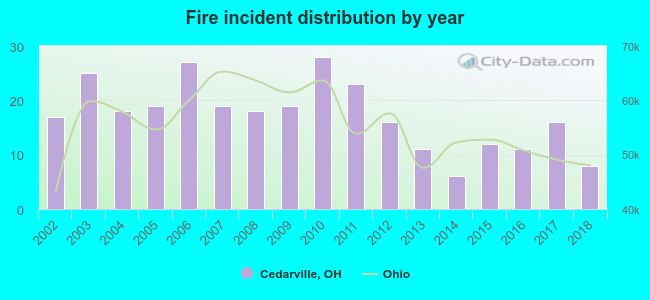 Based on the data from the years 2002 - 2018 the average number of fires per year is 17. The highest number of reported fire incidents - 28 took place in 2010, and the least - 6 in 2014. The data has a declining trend.
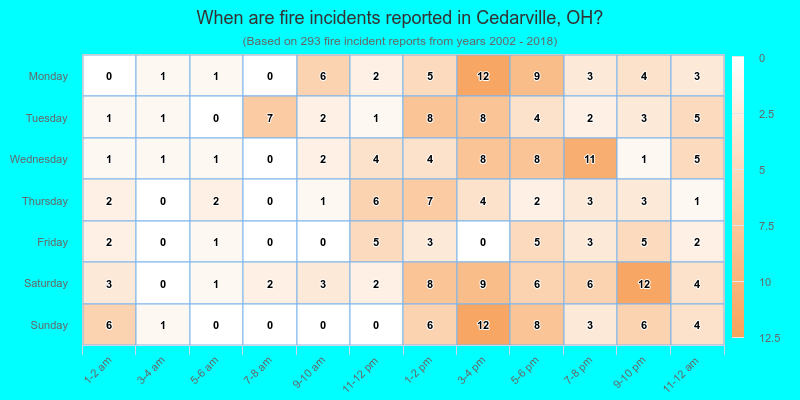
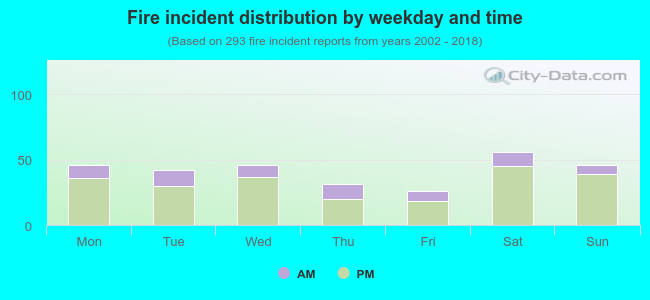 23.2% incidents where reported in the morning and 76.8% in the evening. The most fires (19.1%) took place on Saturday, and the least (8.9%) on Friday.
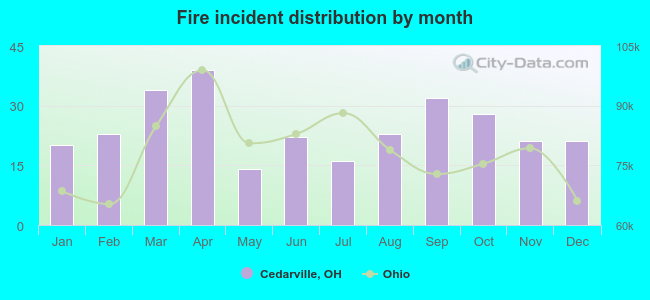 According to the 293 fire incident reports from years 2002 - 2018 most fires (13.3%) took place during April, and the least (4.8%) in May.
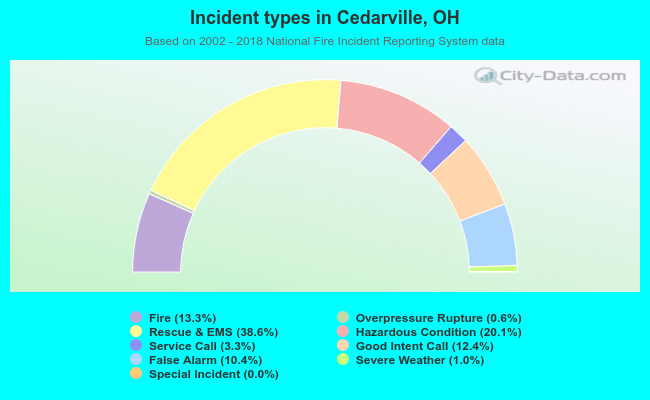 Out of all 2,195 cases reported during the years 2002 - 2018, the most belonged to the categories: Rescue & EMS (38.6%), Hazardous Condition (20.1%), and Fire (13.3%).
 When looking into fire subcategories, the most reports belonged to: Structure Fires (51.9%), and Outside Fires (32.4%).